Open Access
Fig. 8
Download original image
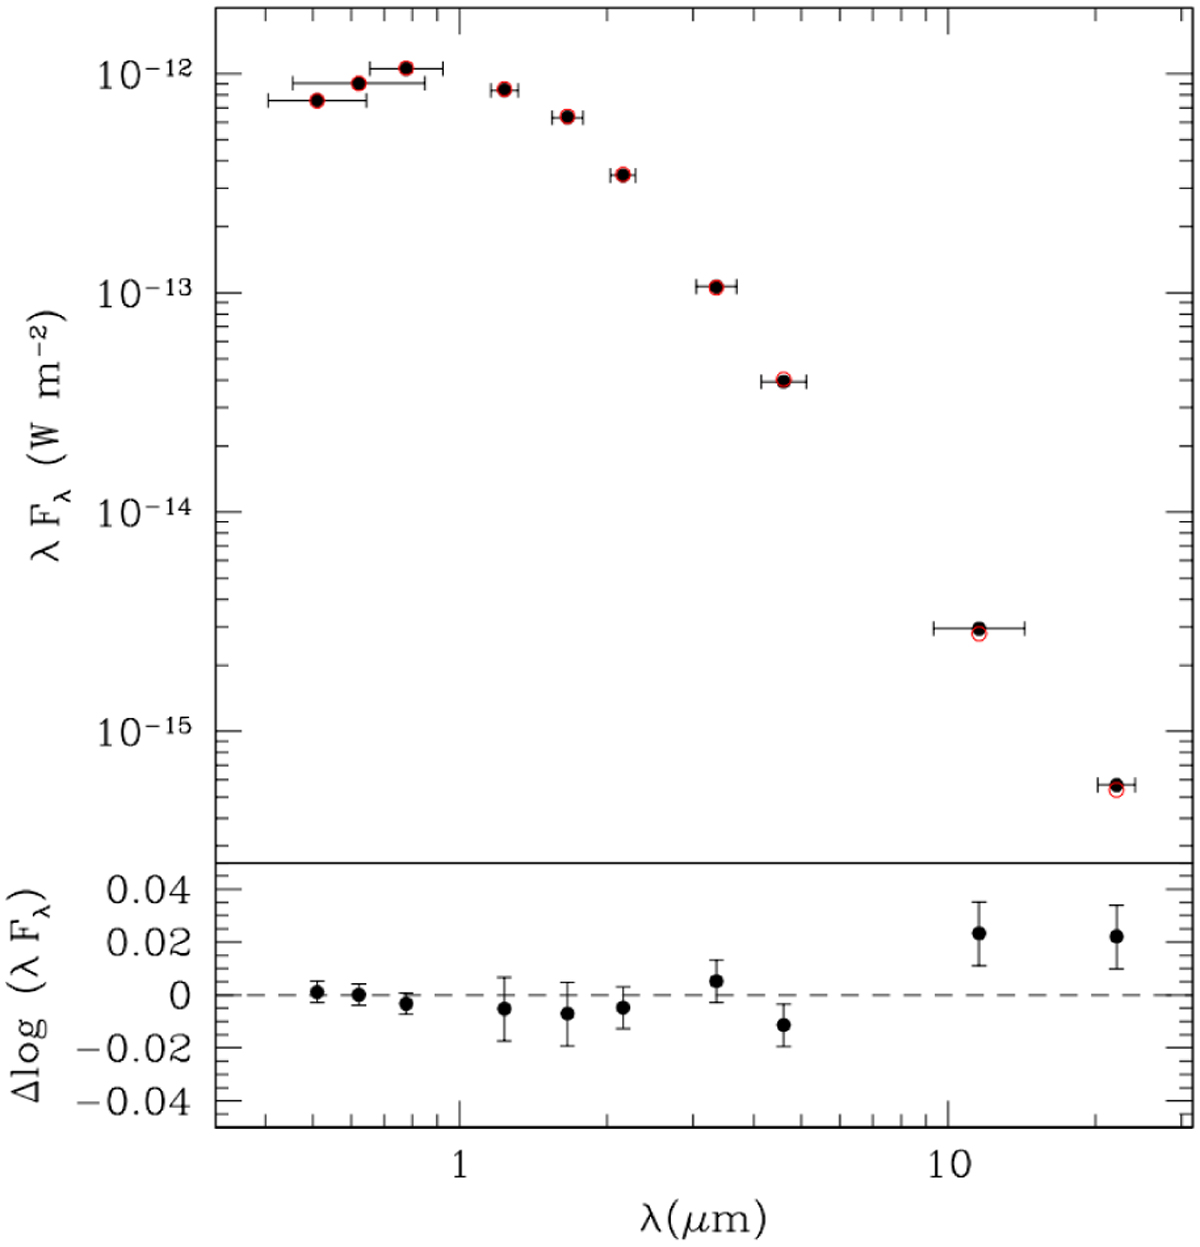
Spectral energy distribution of the target obtained from broadband optical and near-infrared photometry. Top: optical and near-infrared broadband photometric measurements of the target star (black circles) and best-fit model (red open circles). Bottom: difference between logarithm of measurements and model’s estimates.
Current usage metrics show cumulative count of Article Views (full-text article views including HTML views, PDF and ePub downloads, according to the available data) and Abstracts Views on Vision4Press platform.
Data correspond to usage on the plateform after 2015. The current usage metrics is available 48-96 hours after online publication and is updated daily on week days.
Initial download of the metrics may take a while.