Fig. 7
Download original image
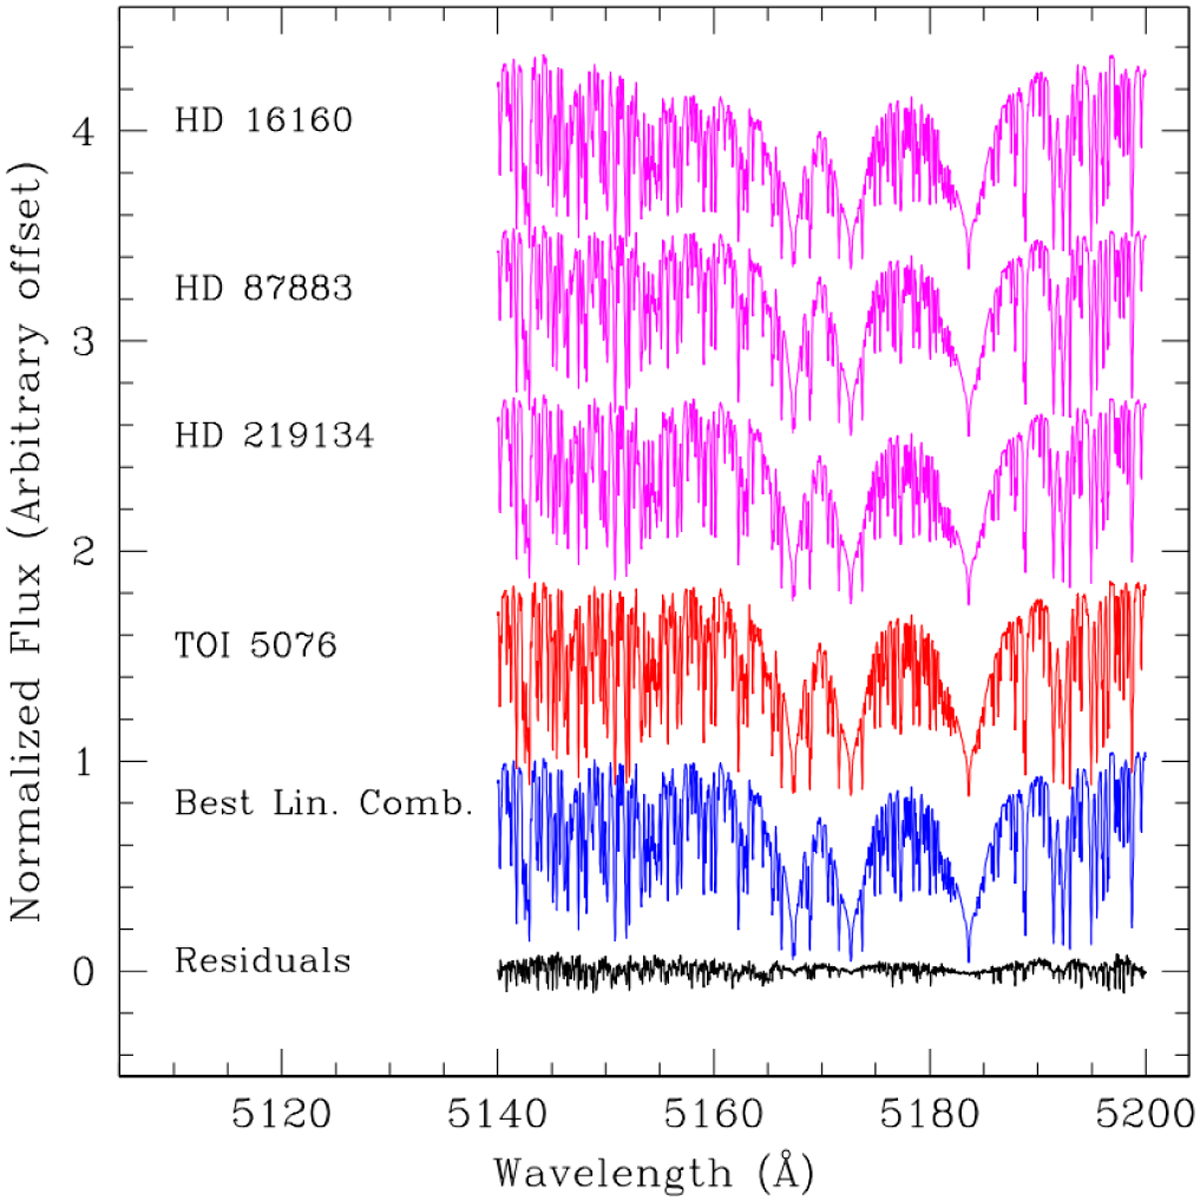
Comparison of target spectrum in Mgb triplet region with empirical spectra in the Yee et al. (2017) library. The target’s spectrum is depicted in red. The three spectra of the library most highly correlated with the target’s spectrum are shown in magenta, while the best-fit linear combination of them is depicted in blue. The residuals between the target’s spectrum and the best fit are represented in black.
Current usage metrics show cumulative count of Article Views (full-text article views including HTML views, PDF and ePub downloads, according to the available data) and Abstracts Views on Vision4Press platform.
Data correspond to usage on the plateform after 2015. The current usage metrics is available 48-96 hours after online publication and is updated daily on week days.
Initial download of the metrics may take a while.