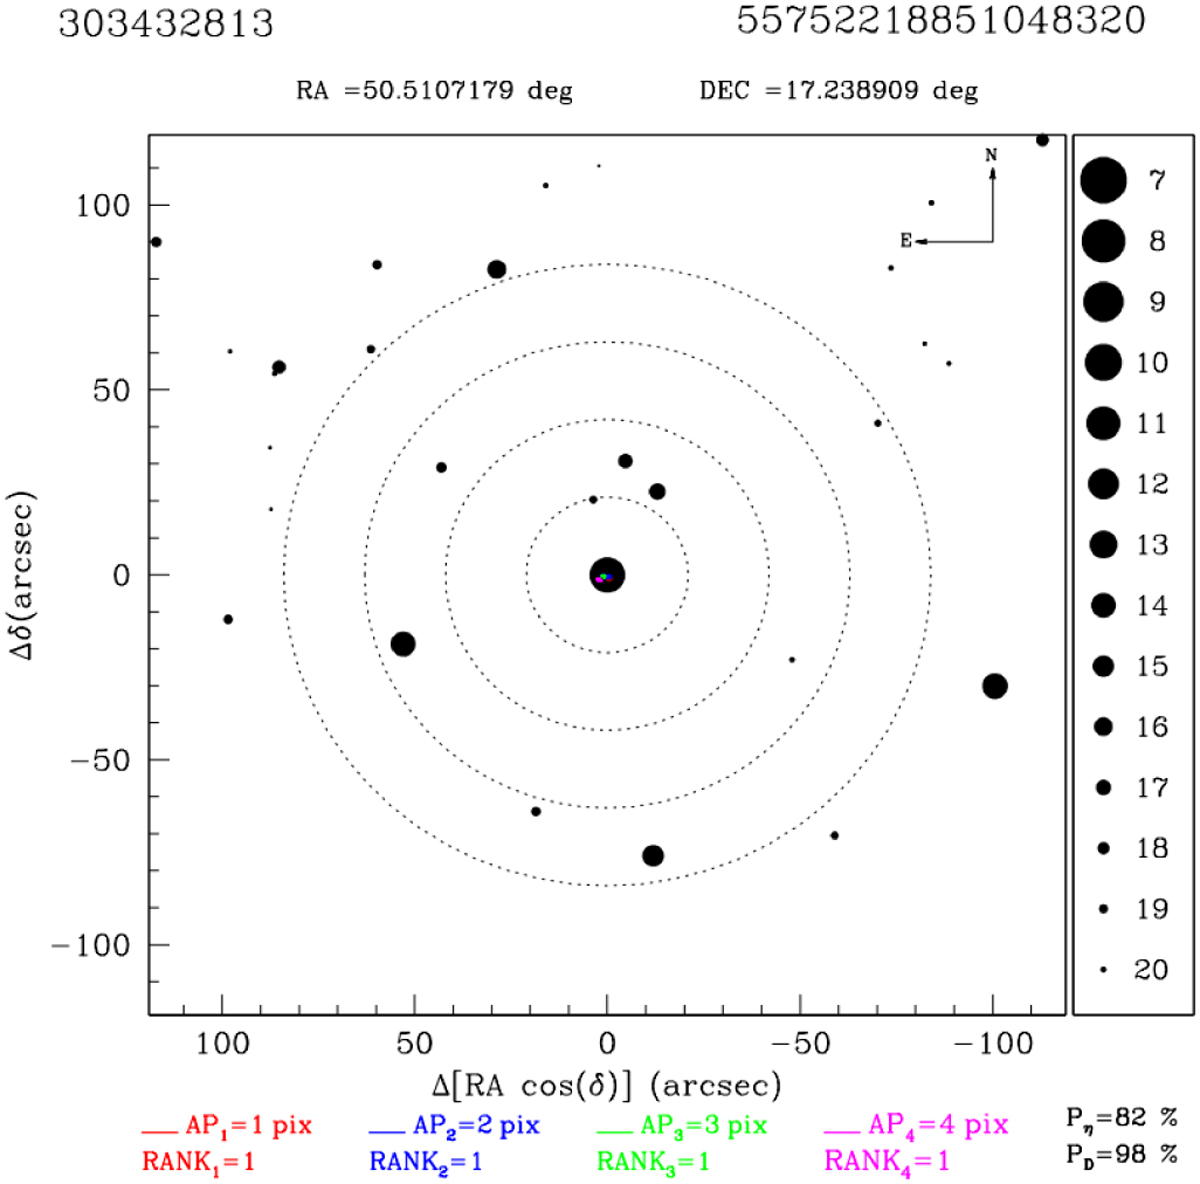
Fig. 5
Download original image
Centroid motion analysis of TOI-5076. The target (at the center) and the surrounding stars are represented by black dots with diameters that are proportional to their Gaia DR3 magnitudes, as indicated by the legend on the right. All positions were corrected for proper motions to report them to the epoch of cadence 175714 of Sector 42. The figure also reports the TIC identification number and the Gaia DR3 source ID (in the top left and top right, respectively), the distributions of the calculated centroid motion measurements in each aperture (central colored ellipses), the Mahlanobis distance ranks, and the centroid motion probabilities (PD and Pη; see text).
Current usage metrics show cumulative count of Article Views (full-text article views including HTML views, PDF and ePub downloads, according to the available data) and Abstracts Views on Vision4Press platform.
Data correspond to usage on the plateform after 2015. The current usage metrics is available 48-96 hours after online publication and is updated daily on week days.
Initial download of the metrics may take a while.