Fig. 13
Download original image
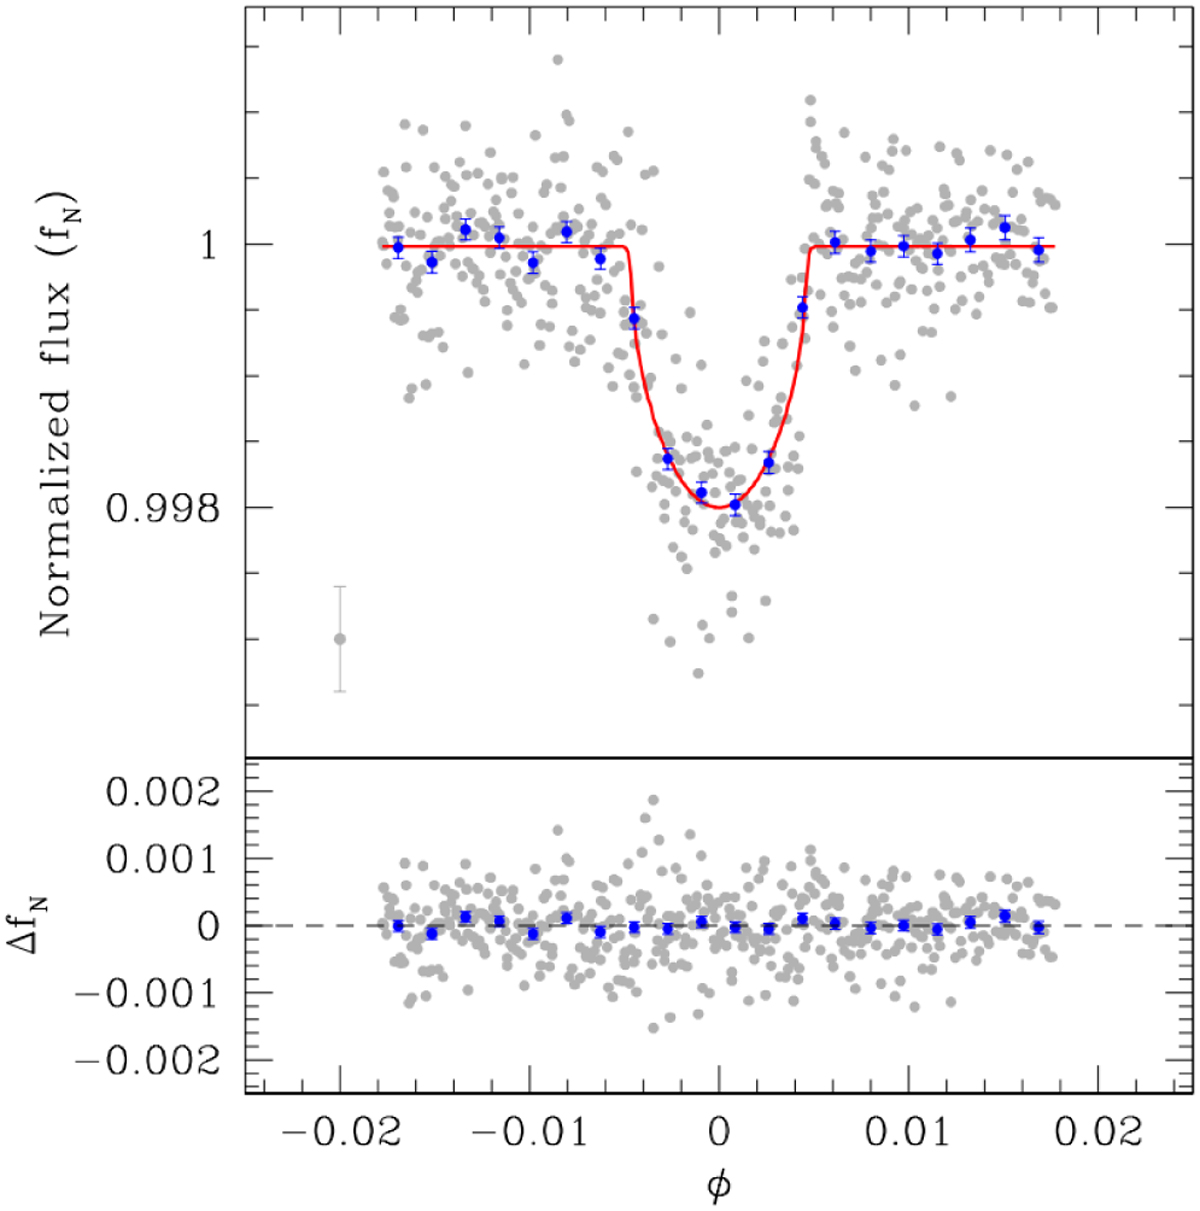
Folded photometric measurements, the best-fit photometric model and residuals of the fit. Top: TESS light curve of TOI-5076 (gray points) folded with best-fit ephemerides. The best-fit transit model is denoted by the red curve. The point in the bottom left depicts the average uncertainty of the photometric measurements. Blue points represent measurements rebinned in 20 phase bins between the minimum and maximum phases. Bottom: residuals of fit.
Current usage metrics show cumulative count of Article Views (full-text article views including HTML views, PDF and ePub downloads, according to the available data) and Abstracts Views on Vision4Press platform.
Data correspond to usage on the plateform after 2015. The current usage metrics is available 48-96 hours after online publication and is updated daily on week days.
Initial download of the metrics may take a while.