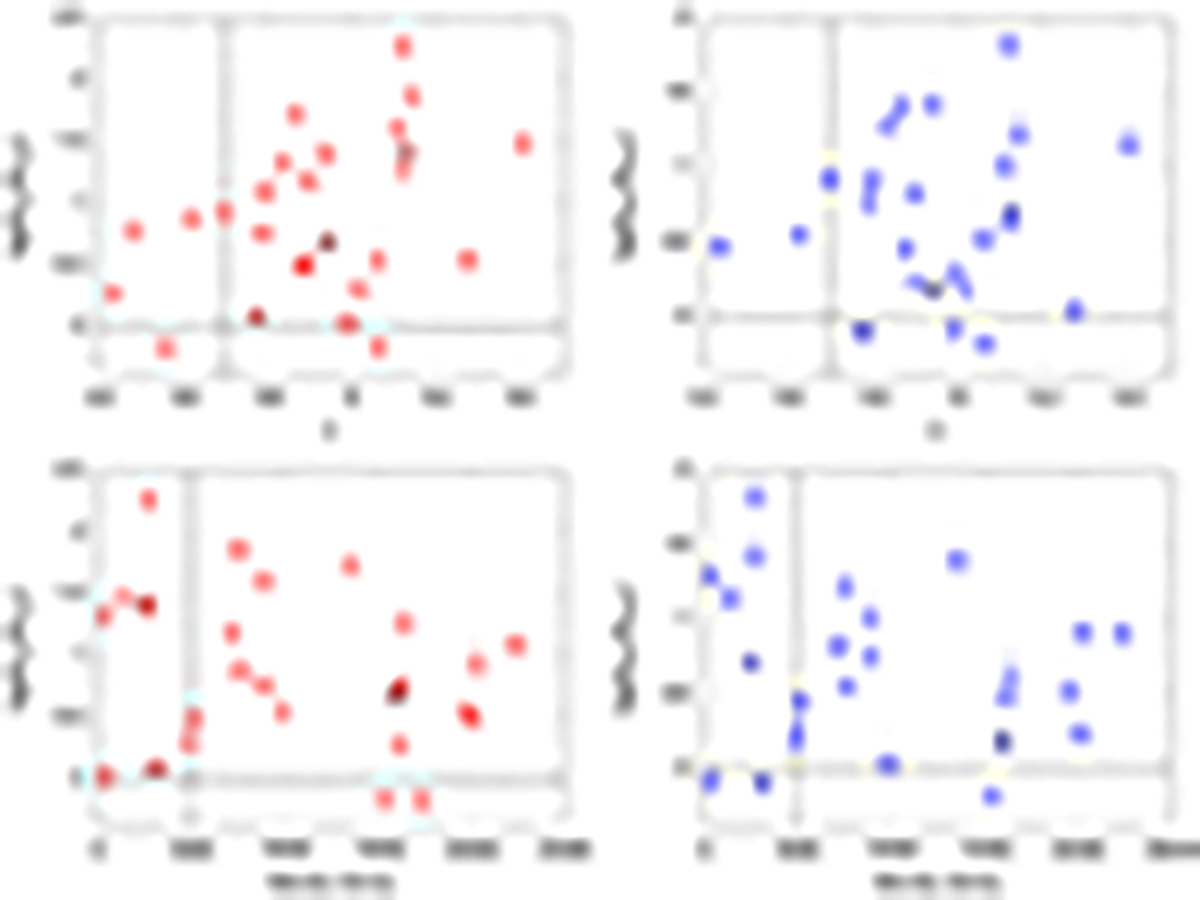
Fig. 9.
Download original image
Ratio of C II/C IV (left panels) and Si II/Si IV (right panels) column densities as a function of redshift (upper panels) and velocity separation from the systemic redshift of the QSO (lower panels) for our sample of O I systems. The dotted vertical lines in the upper panels are drawn at z = 5.7, the limit beyond which the low ionization phase is expected to dominate in the gas (Cooper et al. 2019). The vertical dotted lines in the lower panels mark a velocity separation of 5000 km s−1, which separates PDLAs from intervening DLAs. In each panel, the three systems with black contours (diamond, square and star) are the same highlighted in Figs. 7 and 8.
Current usage metrics show cumulative count of Article Views (full-text article views including HTML views, PDF and ePub downloads, according to the available data) and Abstracts Views on Vision4Press platform.
Data correspond to usage on the plateform after 2015. The current usage metrics is available 48-96 hours after online publication and is updated daily on week days.
Initial download of the metrics may take a while.