Fig. 7.
Download original image
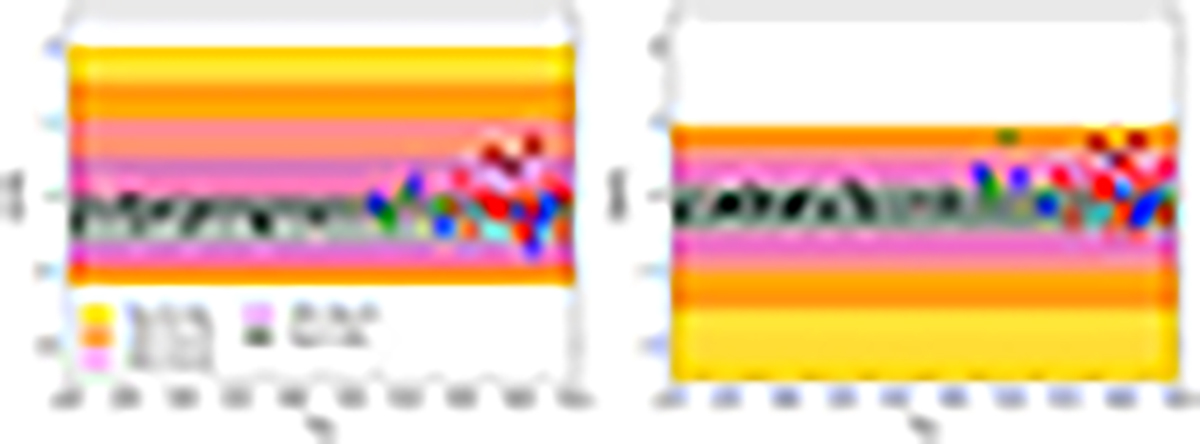
Comparison between the maximum extent of [C/O] (left panel) and [Si/O] (right panel) ISM ratios predicted in the model by Vanni et al. (2024, shaded area) and the measured abundance ratios in absorbers at different redshifts (points with errorbars as in Fig. 6). In each panel the colored areas show the contribution of Pop III stars to the chemical enrichment: 100% (yellow), 90% (orange), 60% (pink), 30% (purple) and ≤0.01% (dark grey: Limongi & Chieffi 2018; light grey: Woosley & Weaver 1995). Only the environments with [O/H] > − 4 are considered. The three remarkable systems with [C/O] > 0.35 and [Si/O] > 0.50 are highlighted using different symbols and black contours: PSO J025−11 at z = 5.7763 (square), SDSS J0100+2802 at z = 5.9450 (star) and PSO J065−26 at z = 6.1263 (diamond).
Current usage metrics show cumulative count of Article Views (full-text article views including HTML views, PDF and ePub downloads, according to the available data) and Abstracts Views on Vision4Press platform.
Data correspond to usage on the plateform after 2015. The current usage metrics is available 48-96 hours after online publication and is updated daily on week days.
Initial download of the metrics may take a while.