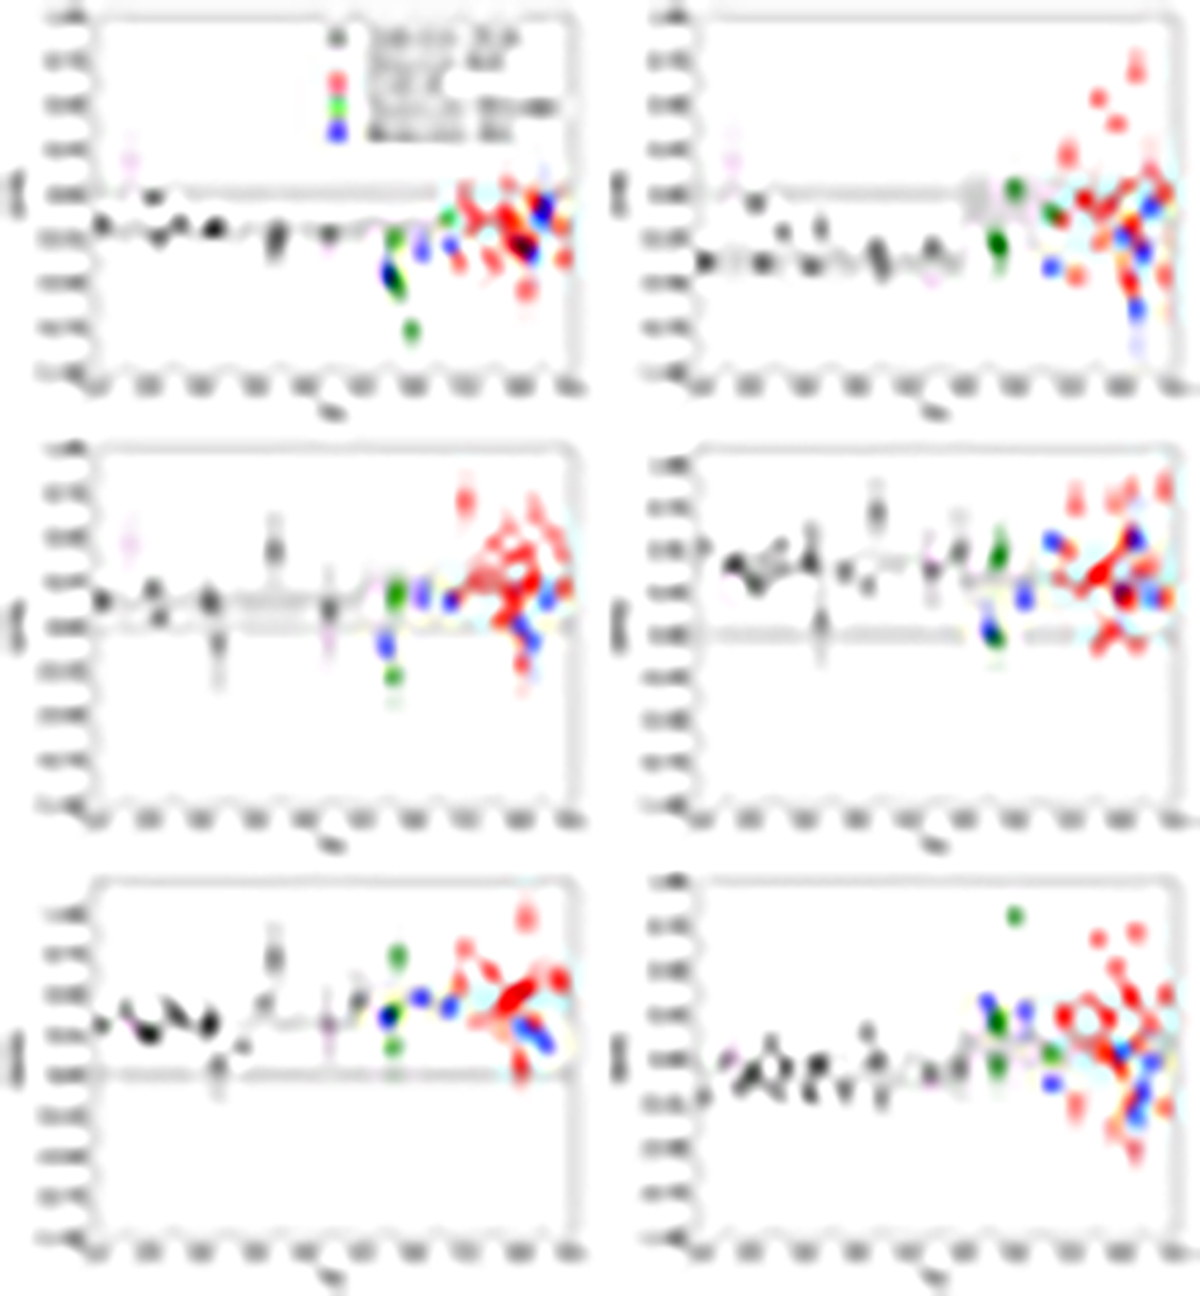
Fig. 6.
Download original image
Relative abundances of DLA systems at z > 2, as a function of redshift. The figure shows the DLA analogs studied in this work (solid red dots), in Becker et al. (2012, solid blue squares) and in Poudel et al. (2018, 2020, solid green diamonds), and the VMP-DLAs analyzed in Cooke et al. (2011, solid black triangles) with the exception of the systems identified in the QSOs J0035−0918 and J1558−0031, and those in Dutta et al. (2014, solid plum inverted triangles) in the QSOs J0035−0918 and J0953−0504. The shaded regions are centred on the weighted average values and represent the standard deviation of the sample (light gray band) and of the sample mean (dark gray band) for the systems in the two redshift bins: 2 ≤ z ≤ 4.5 and 4.5 < z ≤ 6.5.
Current usage metrics show cumulative count of Article Views (full-text article views including HTML views, PDF and ePub downloads, according to the available data) and Abstracts Views on Vision4Press platform.
Data correspond to usage on the plateform after 2015. The current usage metrics is available 48-96 hours after online publication and is updated daily on week days.
Initial download of the metrics may take a while.