Fig. 5.
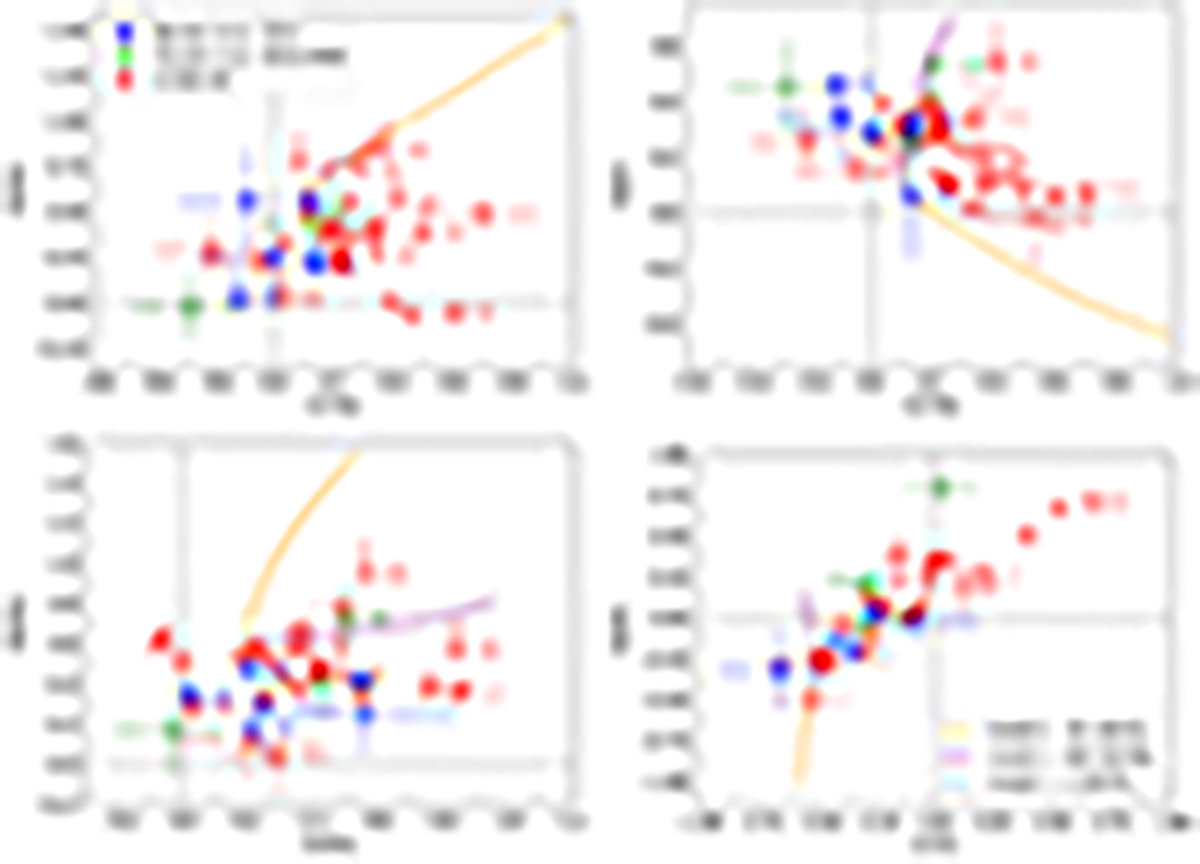
Download original image
Comparison of some of the relative abundances of the O I systems/DLAs at high redshift (z > 4.5) found in this work (red dots), in Becker et al. (2012) (blue squares), and Poudel et al. (2018, 2020) (green diamonds). Dotted lines mark the solar abundance values. We report also the predictions of the simulations by Kulkarni et al. (2013) at z = 6, the three models are described in greater detail the text. Model 1 assigns a 1–100 M⊙ Salpeter IMF to Pop III stars. This is 35–100 M⊙ Salpeter in case of model 2 and 100–260 M⊙ Salpeter for model 3. The prediction of model 1 is the light blue dot at the junction of the lines of model 2 and 3.
Current usage metrics show cumulative count of Article Views (full-text article views including HTML views, PDF and ePub downloads, according to the available data) and Abstracts Views on Vision4Press platform.
Data correspond to usage on the plateform after 2015. The current usage metrics is available 48-96 hours after online publication and is updated daily on week days.
Initial download of the metrics may take a while.