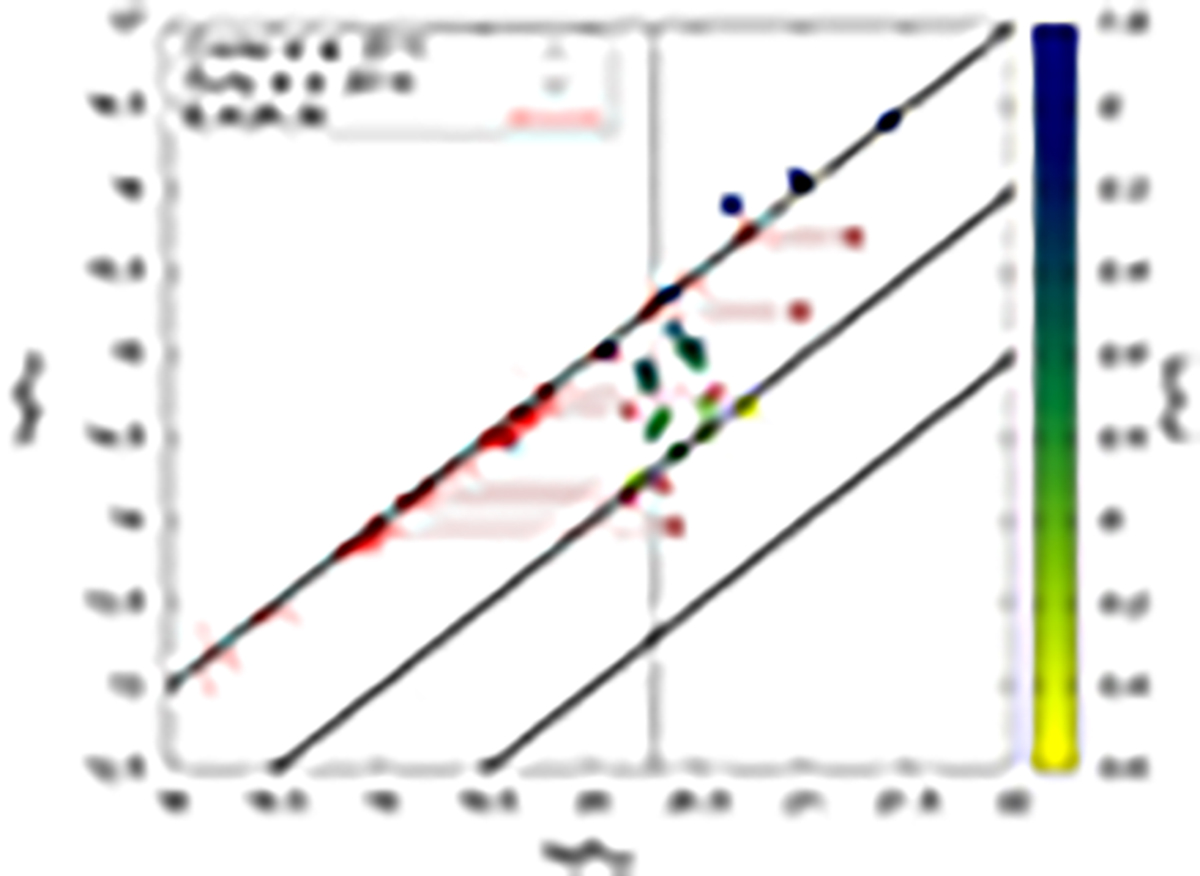
Fig. 2.
Download original image
Log N(O I) as a function of log NH I for the VMP DLAs of Cooke et al. (2011, triangles). The color of the triangles refers to their metallicity measured as [Fe/H] and reported in the side band. The solid black lines are approximately marking metallicities of [Fe/H] ≃ − 2, −3 and −4 (from top to bottom). The dotted black line indicates the column density threshold defining DLAs. The red lower limits on log NH I are the O I absorbers in our sample, red circles indicate PDLA systems. Dark-red crosses mark estimated log NH I for the latter systems, obtained from the fit of the red damping wing of the absorption.
Current usage metrics show cumulative count of Article Views (full-text article views including HTML views, PDF and ePub downloads, according to the available data) and Abstracts Views on Vision4Press platform.
Data correspond to usage on the plateform after 2015. The current usage metrics is available 48-96 hours after online publication and is updated daily on week days.
Initial download of the metrics may take a while.