Fig. 1.
Download original image
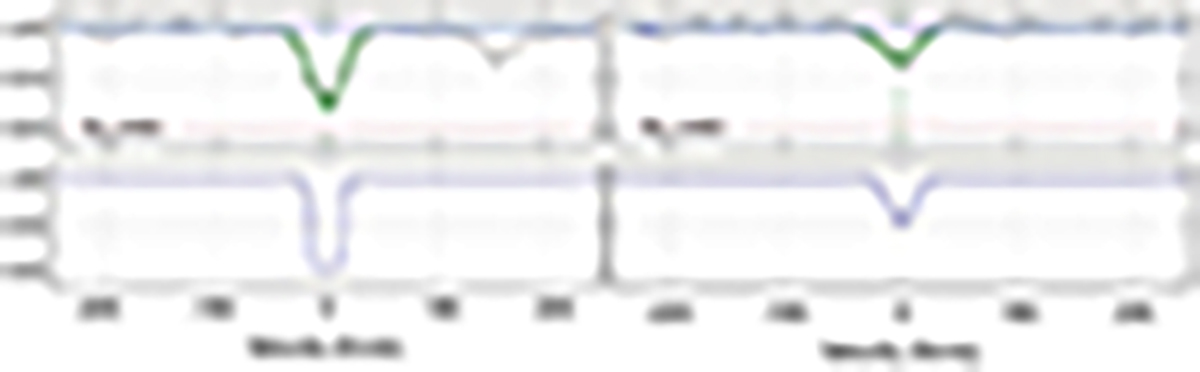
Comparison between two absorption lines fitted with Voigt profiles in XQR-30 (upper panels; black line: observed spectrum; red line: observed error; blue line: continuum level; green line: Voigt profile fit) and their theoretical profiles without the convolution with the instrumental broadening (lower panels). The theoretical profile of the line on the left is saturated, while the theoretical profile of the line on the right is not.
Current usage metrics show cumulative count of Article Views (full-text article views including HTML views, PDF and ePub downloads, according to the available data) and Abstracts Views on Vision4Press platform.
Data correspond to usage on the plateform after 2015. The current usage metrics is available 48-96 hours after online publication and is updated daily on week days.
Initial download of the metrics may take a while.