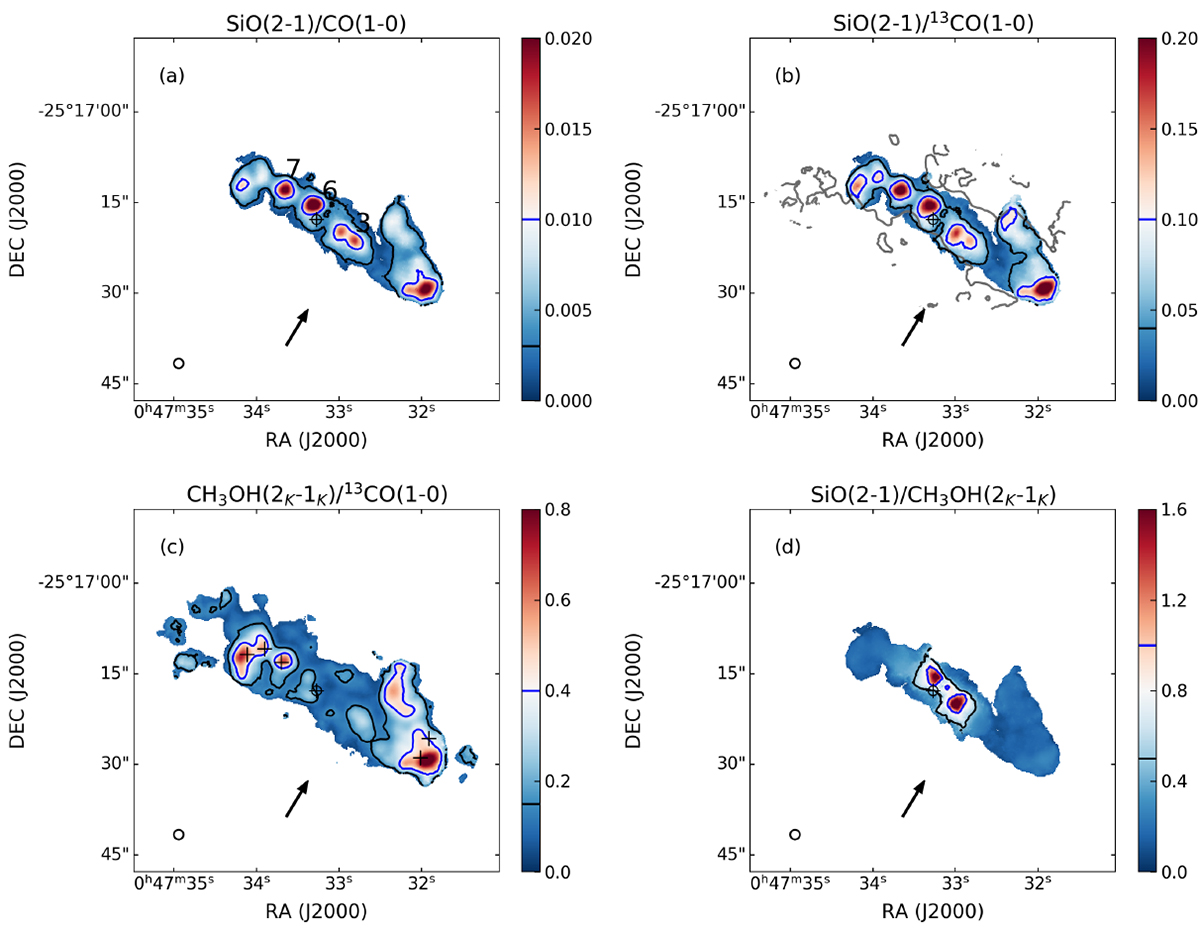
Fig. 8.
Download original image
Integrated intensity ratio maps. (a) Integrated intensity ratio map of SiO(2–1)/CO(1–0). The black contour is drawn at 0.003 and the blue contour at 0.01. The labels 3, 6, and 7 mark the three GMCs. (b) Integrated intensity ratio map of SiO(2–1)/13CO(1–0). The black contour is drawn at 0.04 and the blue contour at 0.1. The gray contour is drawn at a CO/13CO(1–0) ratio of 15. (c) Integrated intensity ratio map of CH3OH(2k–1k)/13CO(1–0). The black contour is drawn at 0.15 and the blue contour at 0.4. (d) Integrated intensity ratio map of SiO(2–1)/CH3OH(2k–1k). The black contour is drawn at 0.5 and the blue contour at 1.
Current usage metrics show cumulative count of Article Views (full-text article views including HTML views, PDF and ePub downloads, according to the available data) and Abstracts Views on Vision4Press platform.
Data correspond to usage on the plateform after 2015. The current usage metrics is available 48-96 hours after online publication and is updated daily on week days.
Initial download of the metrics may take a while.