Fig. 7.
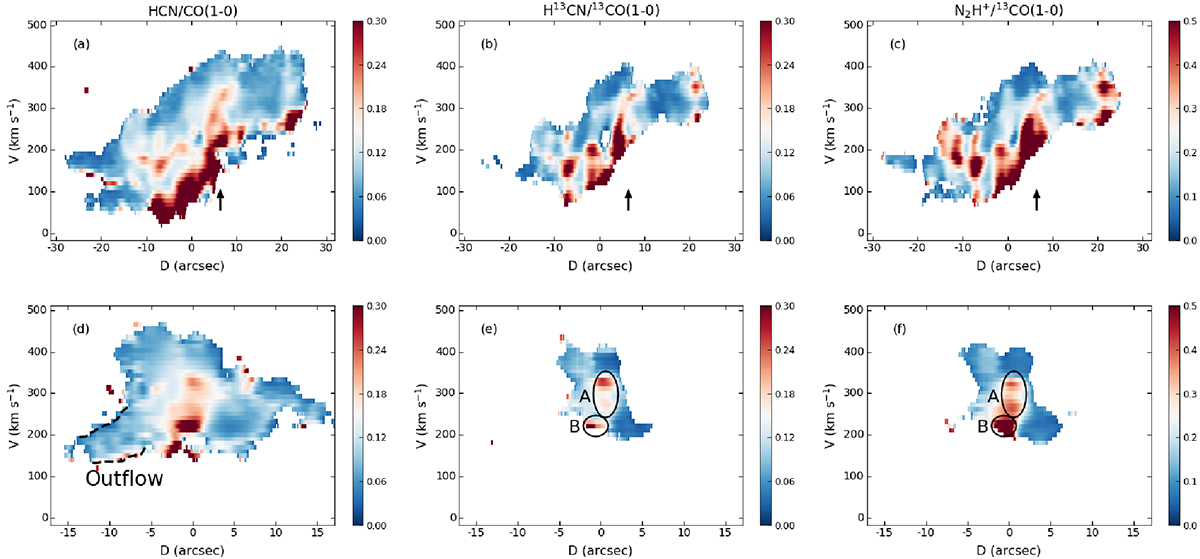
Download original image
First row: PVDs along the major axis. Second row: PVDs along the SW slice. (a,d) HCN/CO(1–0) ratio in PVDs. The dashed black profiles in panel d outline the outflow in the SW streamer region. (b,e) H13CN/13CO(1–0) ratio in PVDs. In panel e, the black ellipse named region A outlines the gas with D ∼ 0 arcsec and V ∼ 300 km s −1 and the black ellipse named region B outlines the gas with D ∼ [ − 5, 0] arcsec and V ∼ 200 km s−1; these are kept the same in subsequent figures. (c,f) N2H+/13CO(1–0) ratio in PVDs.
Current usage metrics show cumulative count of Article Views (full-text article views including HTML views, PDF and ePub downloads, according to the available data) and Abstracts Views on Vision4Press platform.
Data correspond to usage on the plateform after 2015. The current usage metrics is available 48-96 hours after online publication and is updated daily on week days.
Initial download of the metrics may take a while.