Open Access
Fig. 6.
Download original image
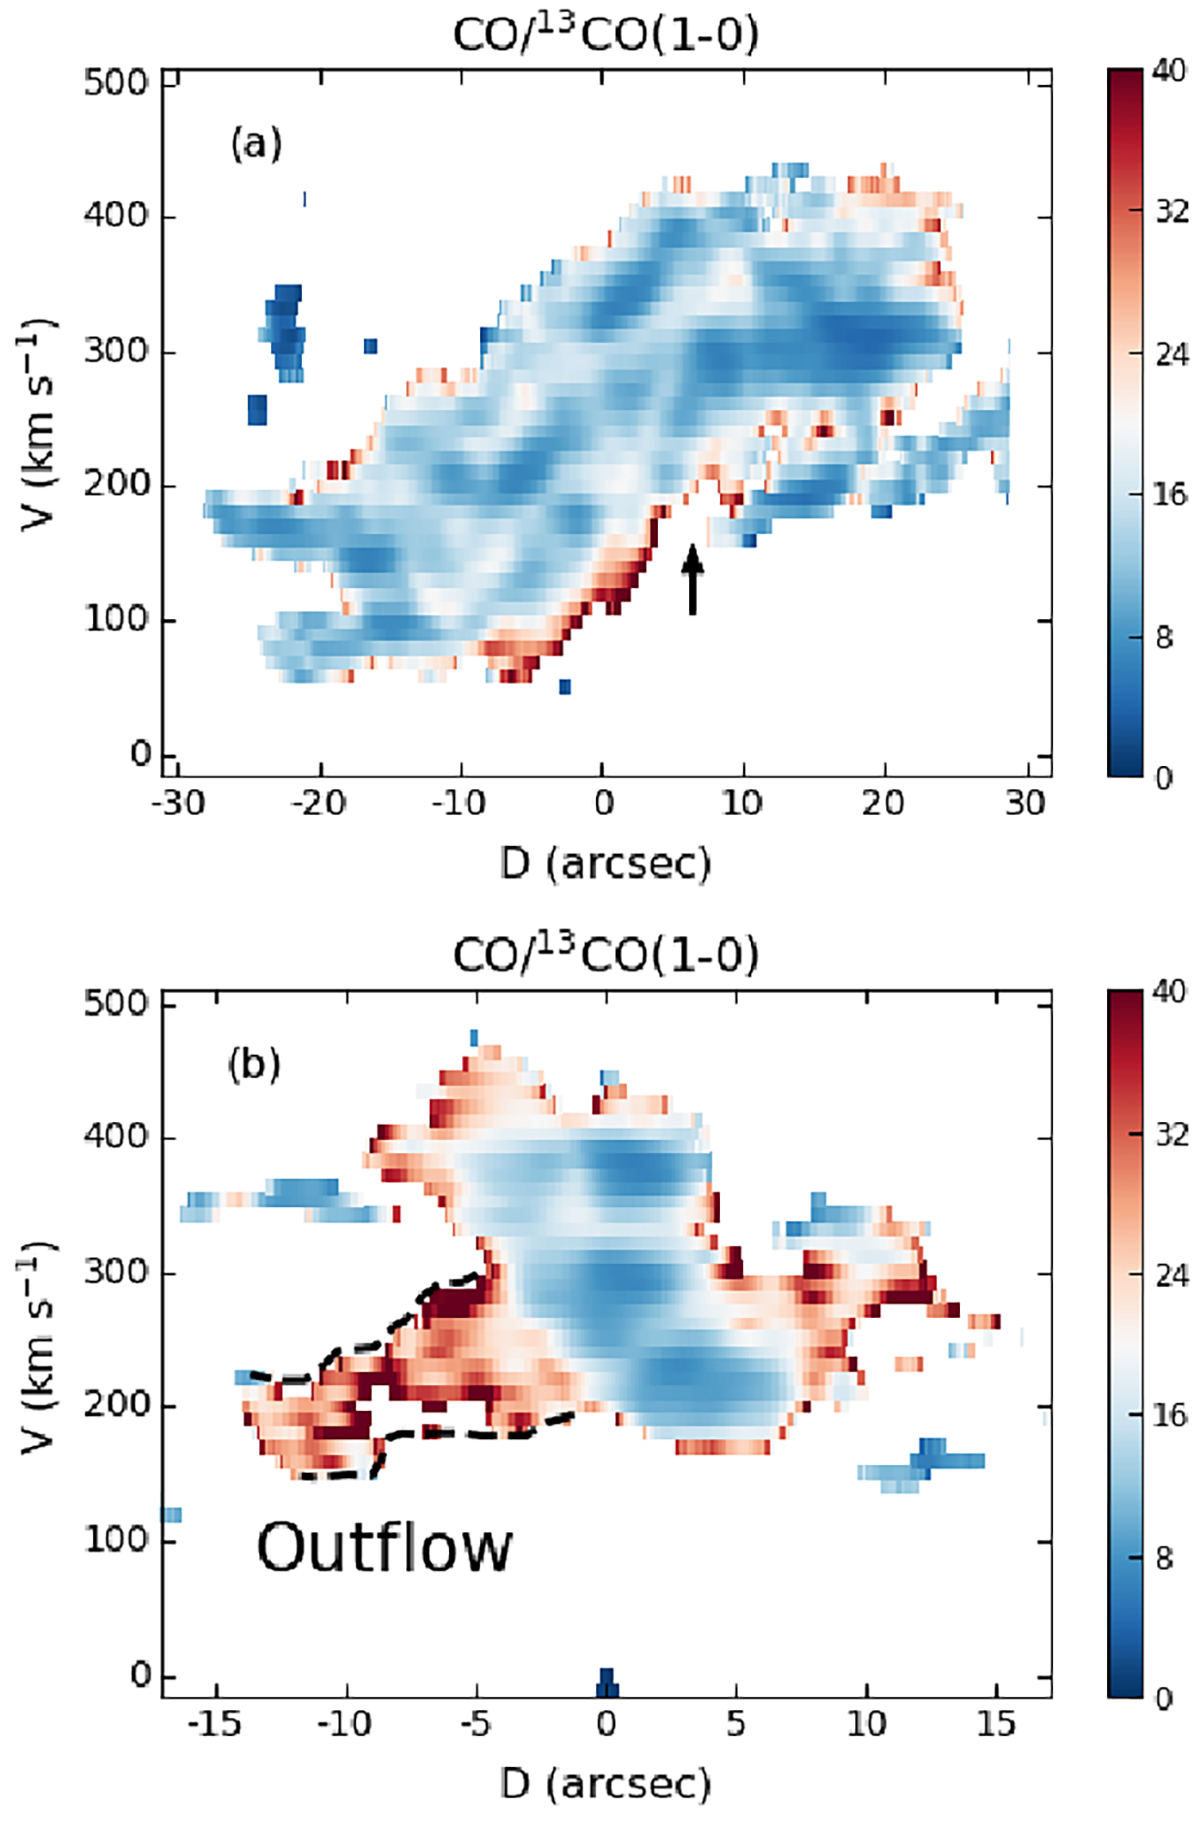
Intensity ratio in the PVDs. (a) Intensity ratio of CO/13CO(1–0) in the PVD along the major axis. The black arrow points to the SW streamer and remains the same in subsequent figures. (b) Intensity ratio of CO/13CO(1–0) in the PVD along the SW slice. The dashed black profiles outline the outflow in the SW streamer region.
Current usage metrics show cumulative count of Article Views (full-text article views including HTML views, PDF and ePub downloads, according to the available data) and Abstracts Views on Vision4Press platform.
Data correspond to usage on the plateform after 2015. The current usage metrics is available 48-96 hours after online publication and is updated daily on week days.
Initial download of the metrics may take a while.