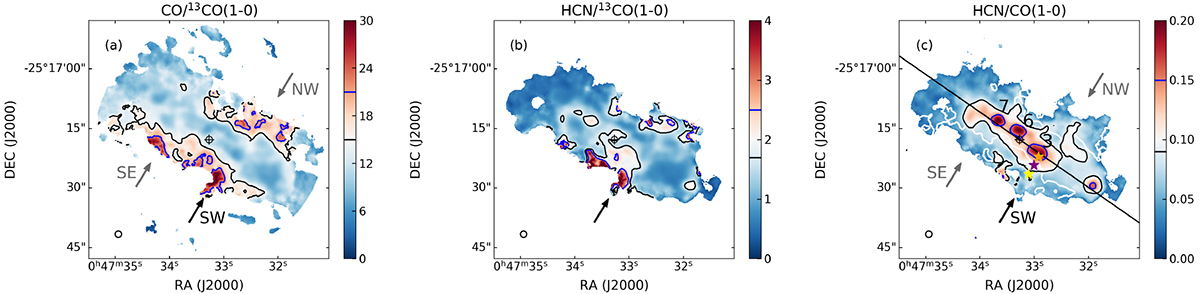
Fig. 5.
Download original image
Integrated intensity ratio maps. (a) Integrated intensity ratio map of CO/13CO(1–0). The ratios are taken in K km s−1 units, and remain the same in the following integrated intensity ratio plots. The black contour is drawn at 15 and the blue contour at 21. The gray arrows point to the outflow in the SE and NW directions. (b) Integrated intensity ratio map of HCN/13CO(1–0). The black contour is drawn at 1.4 and the blue contour at 2. (c) Integrated intensity ratio map of HCN/CO(1–0). The solid black line marks the major axis. The black contour is drawn at 0.09 and the blue contour at 0.15. The white contour is drawn at a CO/13CO(1–0) ratio of 15. The orange, purple, and yellow stars mark the positions at −1.5″, −4″, and −6.5″ offsets along the SW slice. The labels 3, 6, and 7 mark three GMCs. The gray arrows point to the outflow in the SE and NW directions.
Current usage metrics show cumulative count of Article Views (full-text article views including HTML views, PDF and ePub downloads, according to the available data) and Abstracts Views on Vision4Press platform.
Data correspond to usage on the plateform after 2015. The current usage metrics is available 48-96 hours after online publication and is updated daily on week days.
Initial download of the metrics may take a while.