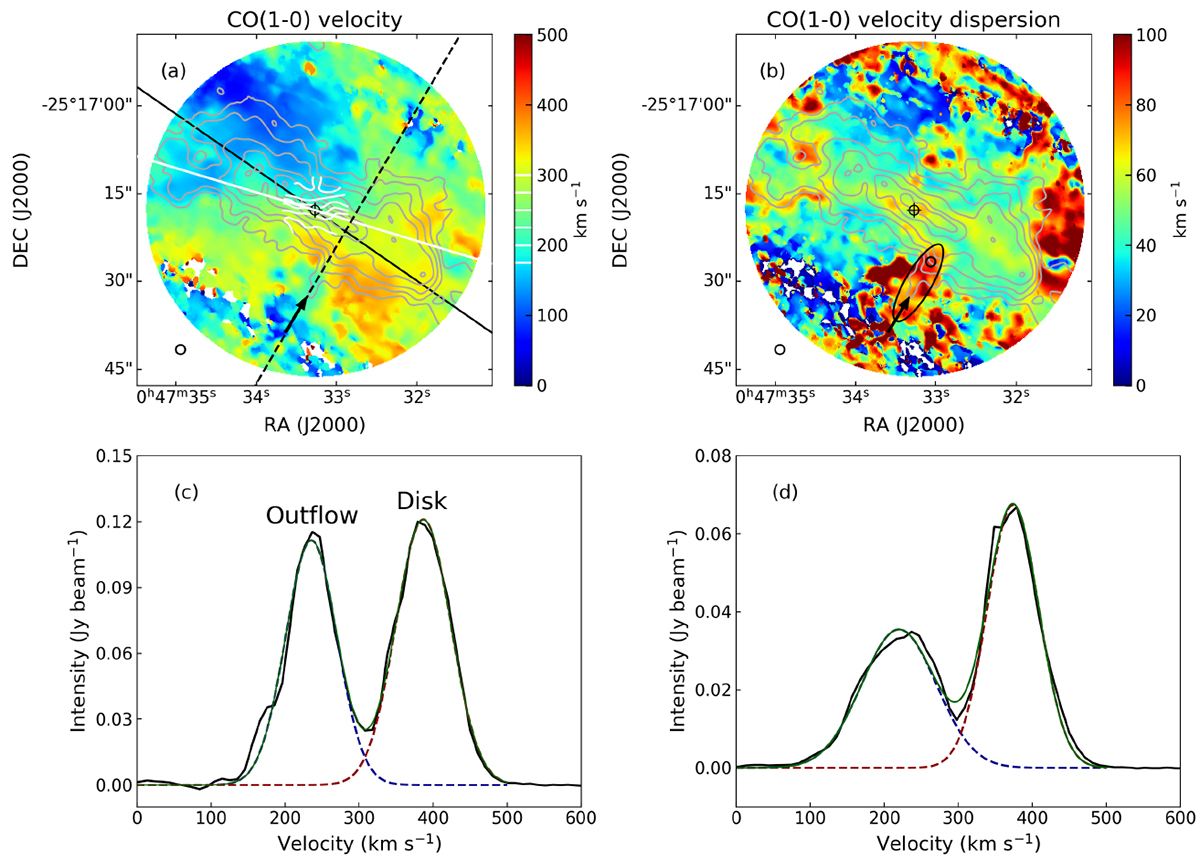
Fig. 4.
Download original image
Kinematic features of CO(1–0). (a) Velocity field of CO(1–0). The gray contours are the same as in Fig. 1a. The white contours mark the [175, 300] km s−1 velocity range with a step of 25 km s−1 in the central ∼100 pc. The solid white line shows the direction of the molecular bar. The solid and dashed black lines are the same as in Fig. 1a. The black arrow is the same as the white one in Fig. 1a, and indicates the same region in panel b and the following figures. (b) Velocity dispersion field of CO(1–0). The gray contours are the same as in panel a. The empty black ellipse outlines the high-velocity-dispersion region in the SW streamer region. The empty black circle inside the ellipse marks a beam-size region in the SW streamer region. (c) The averaged CO(1–0) spectrum from the empty black circle in panel b. The black profile shows the CO(1–0) line. The dashed blue profile shows the blueshifted Gaussian component. The dashed red profile shows the redshifted Gaussian component. The solid green profile is the superposition. (d) The averaged CO(1–0) spectrum from the empty black ellipse in panel b. The color codes are the same as in panel c.
Current usage metrics show cumulative count of Article Views (full-text article views including HTML views, PDF and ePub downloads, according to the available data) and Abstracts Views on Vision4Press platform.
Data correspond to usage on the plateform after 2015. The current usage metrics is available 48-96 hours after online publication and is updated daily on week days.
Initial download of the metrics may take a while.