Fig. 3.
Download original image
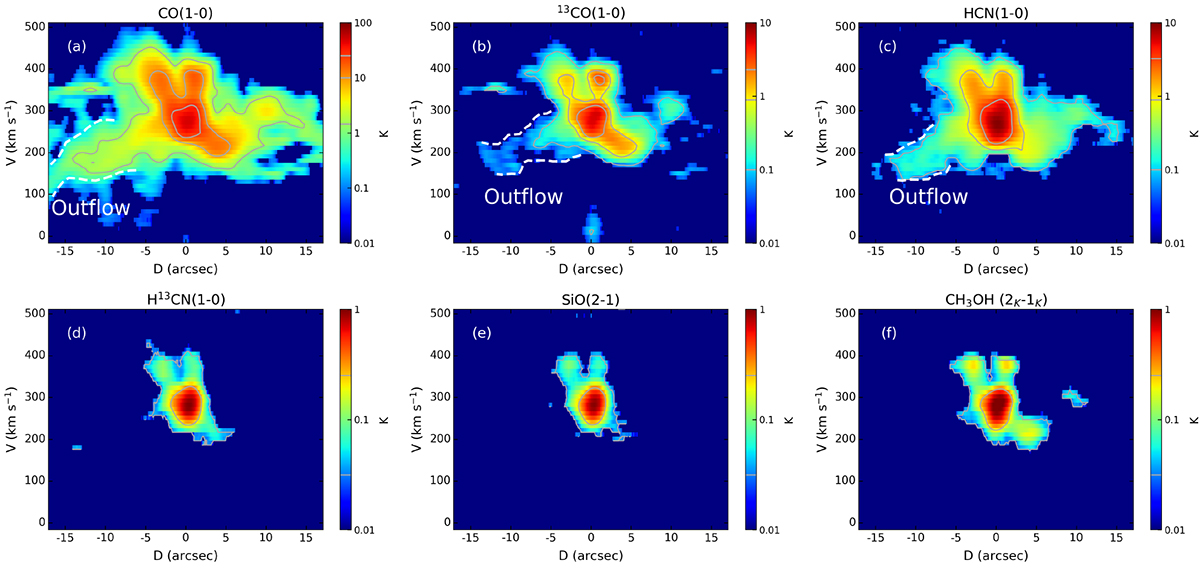
Intensities of molecular lines in the PVDs along the SW slice. The SW slice is marked by the dashed black line in Fig. 1a, on which the black arrow shows the positive direction of the position. (a) CO(1–0) PVD. The gray contours are drawn at ∼[1.5, 10, 25] K. The dashed white profiles in panels a, b, and c outline the outflow in the SW streamer region. (b) 13CO(1–0) PVD. The gray contours are drawn at ∼[0.1, 0.9, 2.3] K. (c) HCN(1–0) PVD. The gray contours are drawn at ∼[0.1, 0.9, 3.2] K. (d) H13CN(1–0) PVD. The gray contours are drawn at ∼[0.03, 0.25] K. (e) SiO(2–1) PVD. The gray contours are drawn at ∼[0.03, 0.25] K. (f) CH3OH(2k–1k) PVD. The gray contours are drawn at ∼[0.03, 0.25] K.
Current usage metrics show cumulative count of Article Views (full-text article views including HTML views, PDF and ePub downloads, according to the available data) and Abstracts Views on Vision4Press platform.
Data correspond to usage on the plateform after 2015. The current usage metrics is available 48-96 hours after online publication and is updated daily on week days.
Initial download of the metrics may take a while.