Fig. 11.
Download original image
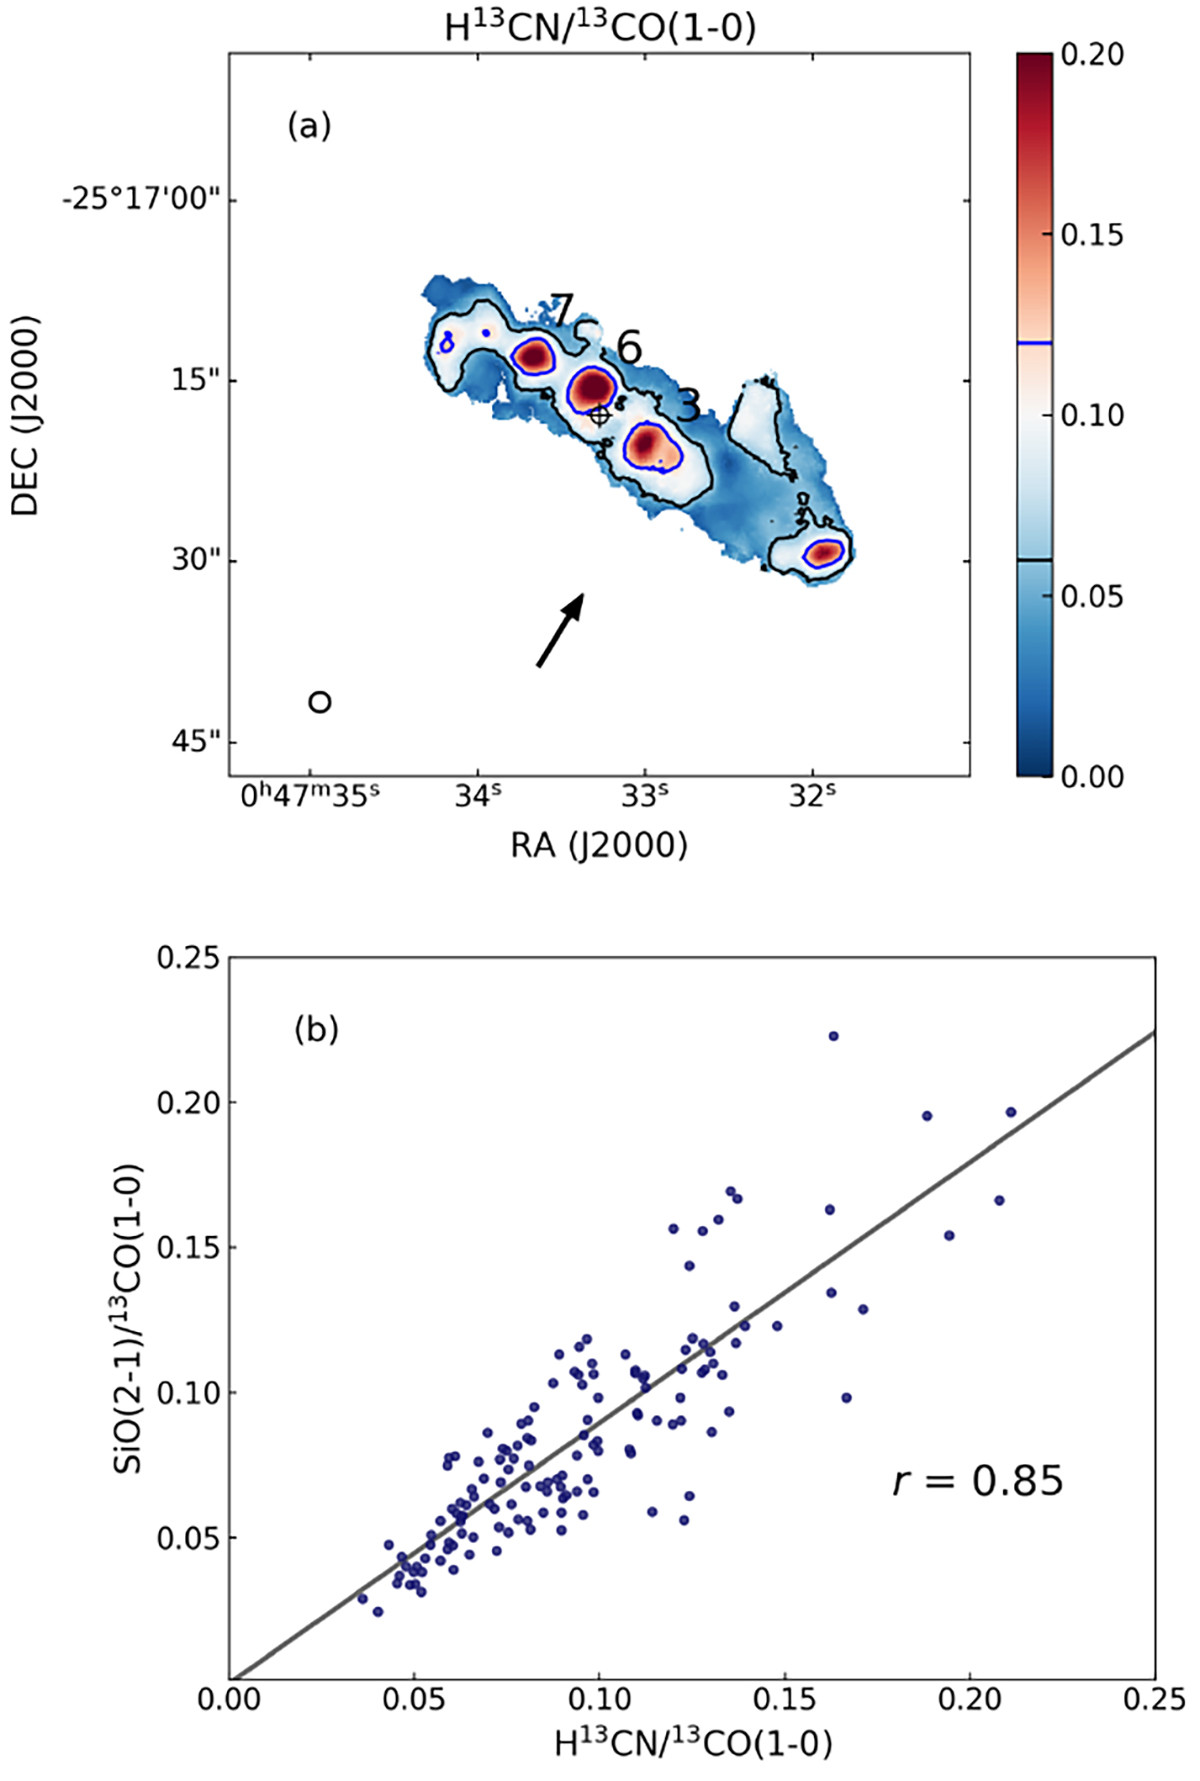
Correlation between the dense gas fraction and the strength of fast shocks. (a) Integrated intensity ratio map of H13CN/13CO(1–0). The black contour is drawn at 0.06 and the blue contour at 0.12. The labels 3, 6, and 7 mark the same GMCs as in Fig. 5c. (b) Correlation between H13CN/13CO(1–0) and SiO(2–1)/13CO(1–0). The blue points mark the ratios from pixels with a spatial resolution equaling the beam size. The solid gray line shows the result of a linear fit to the blue points.
Current usage metrics show cumulative count of Article Views (full-text article views including HTML views, PDF and ePub downloads, according to the available data) and Abstracts Views on Vision4Press platform.
Data correspond to usage on the plateform after 2015. The current usage metrics is available 48-96 hours after online publication and is updated daily on week days.
Initial download of the metrics may take a while.