Fig. 10.
Download original image
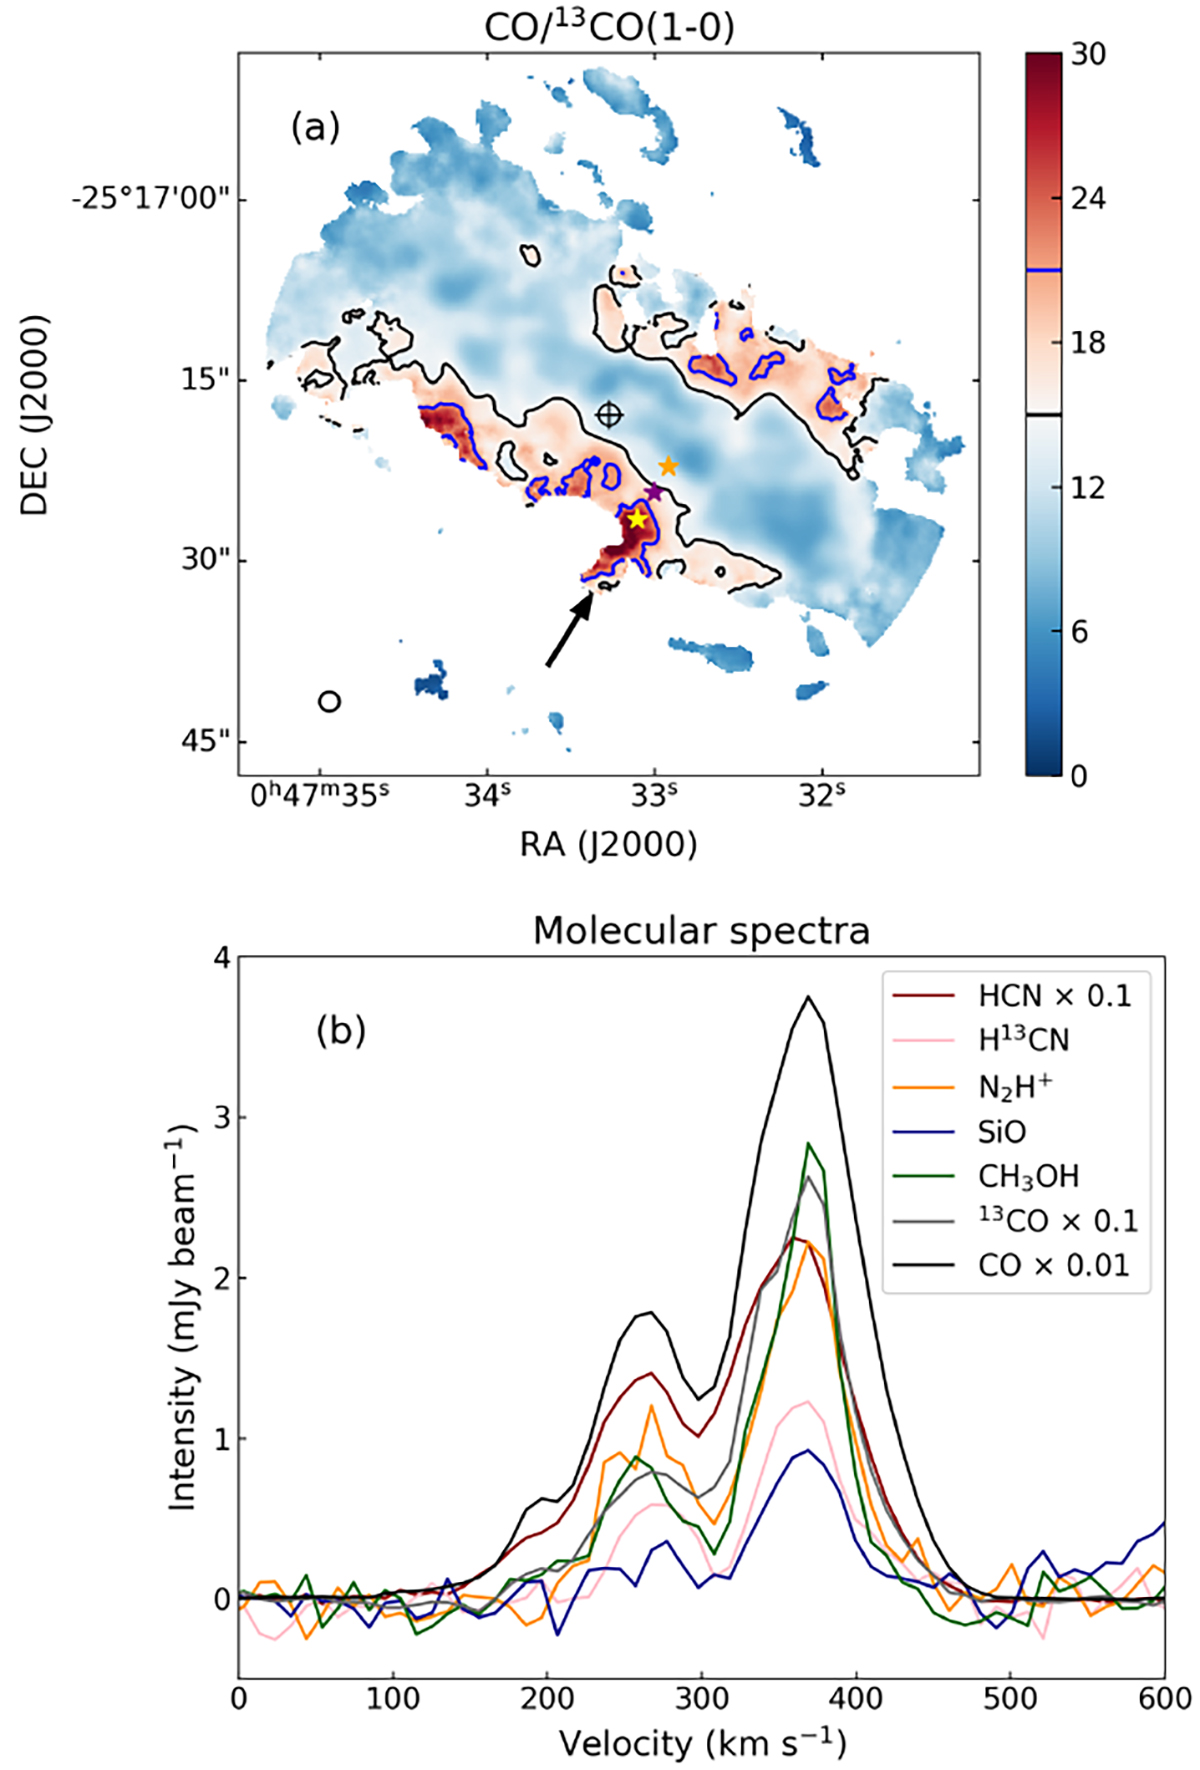
Molecular spectra in the SW streamer region. (a) Integrated intensity ratio map of CO/13CO(1–0). The black contour is drawn at 15 and the blue contour at 21. The orange, purple, and yellow stars are the same as in Fig. 5c. (b) Averaged molecular spectra extracted from a beam-size region centered on the purple star in panel a. The color codes are labeled in the top left. The averaged intensity of the CO(1–0) line is scaled down by a factor of 100. The averaged intensities of 13CO(1–0) and HCN(1–0) lines are scaled down by a factor of 10.
Current usage metrics show cumulative count of Article Views (full-text article views including HTML views, PDF and ePub downloads, according to the available data) and Abstracts Views on Vision4Press platform.
Data correspond to usage on the plateform after 2015. The current usage metrics is available 48-96 hours after online publication and is updated daily on week days.
Initial download of the metrics may take a while.