Fig. 1.
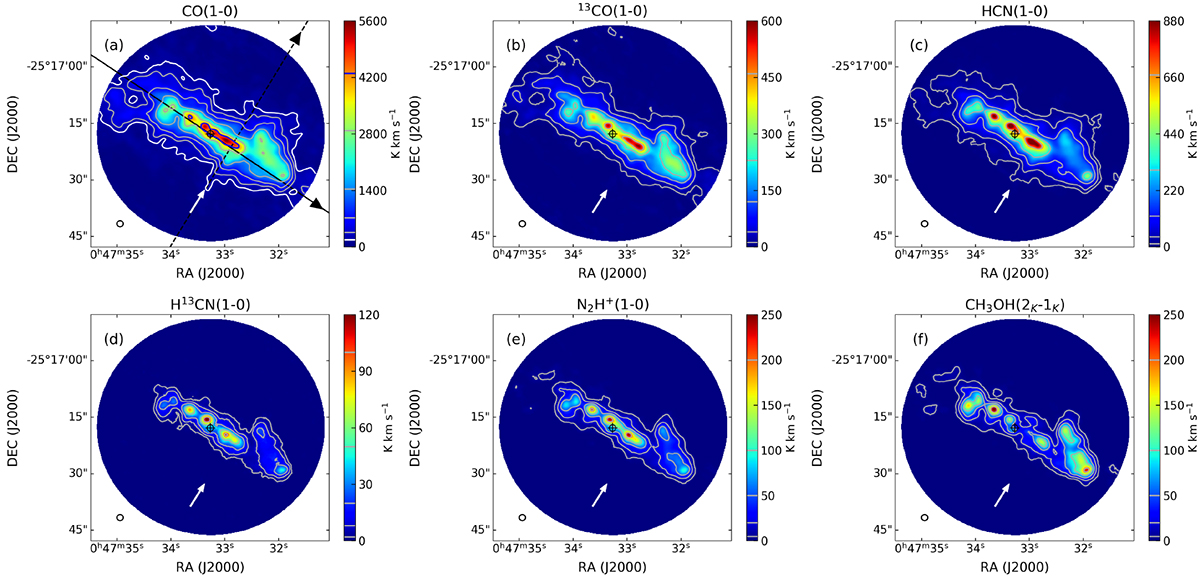
Download original image
Integrated intensity maps of the transitions used in this work. (a) Integrated intensity map of CO(1–0). The white contour is drawn at 180 K km s−1, the gray contours are drawn at [360, 720, 1440, 2880] K km s−1, and the blue contour is drawn at 4300 K km s−1. The horizontal lines in different colors inside the color bar mark the values of corresponding contours, and remain the same in the following figures. The solid black line marks the major axis, and the dashed black line marks the slice across the SW streamer, on which the black arrows show the positive directions of the PVDs in the following figures. The white arrow points to the SW streamer and remains the same in subsequent panels. The black cross marks the phase center of the observation and remains the same in subsequent figures. The beam size of 1.6″ is shown as an empty black circle in the bottom-left corner of each panel and remains the same in subsequent figures. (b) Integrated intensity map of 13CO(1–0). The gray contours are drawn at [12, 40, 120, 230, 460] K km s−1. (c) Integrated intensity map of HCN(1–0). The gray contours are drawn at [12, 40, 120, 300, 670] K km s−1. (d) Integrated intensity map of H13CN(1–0). The gray contours are drawn at [2, 8, 20, 50, 100] K km s−1. (e) Integrated intensity map of N2H+(1–0). The gray contours are drawn at [5, 20, 50, 100, 200] K km s−1. (f) Integrated intensity map of CH3OH(2k–1k). The gray contours are drawn at [5, 20, 50, 100, 200] K km s−1.
Current usage metrics show cumulative count of Article Views (full-text article views including HTML views, PDF and ePub downloads, according to the available data) and Abstracts Views on Vision4Press platform.
Data correspond to usage on the plateform after 2015. The current usage metrics is available 48-96 hours after online publication and is updated daily on week days.
Initial download of the metrics may take a while.