Fig. 8
Download original image
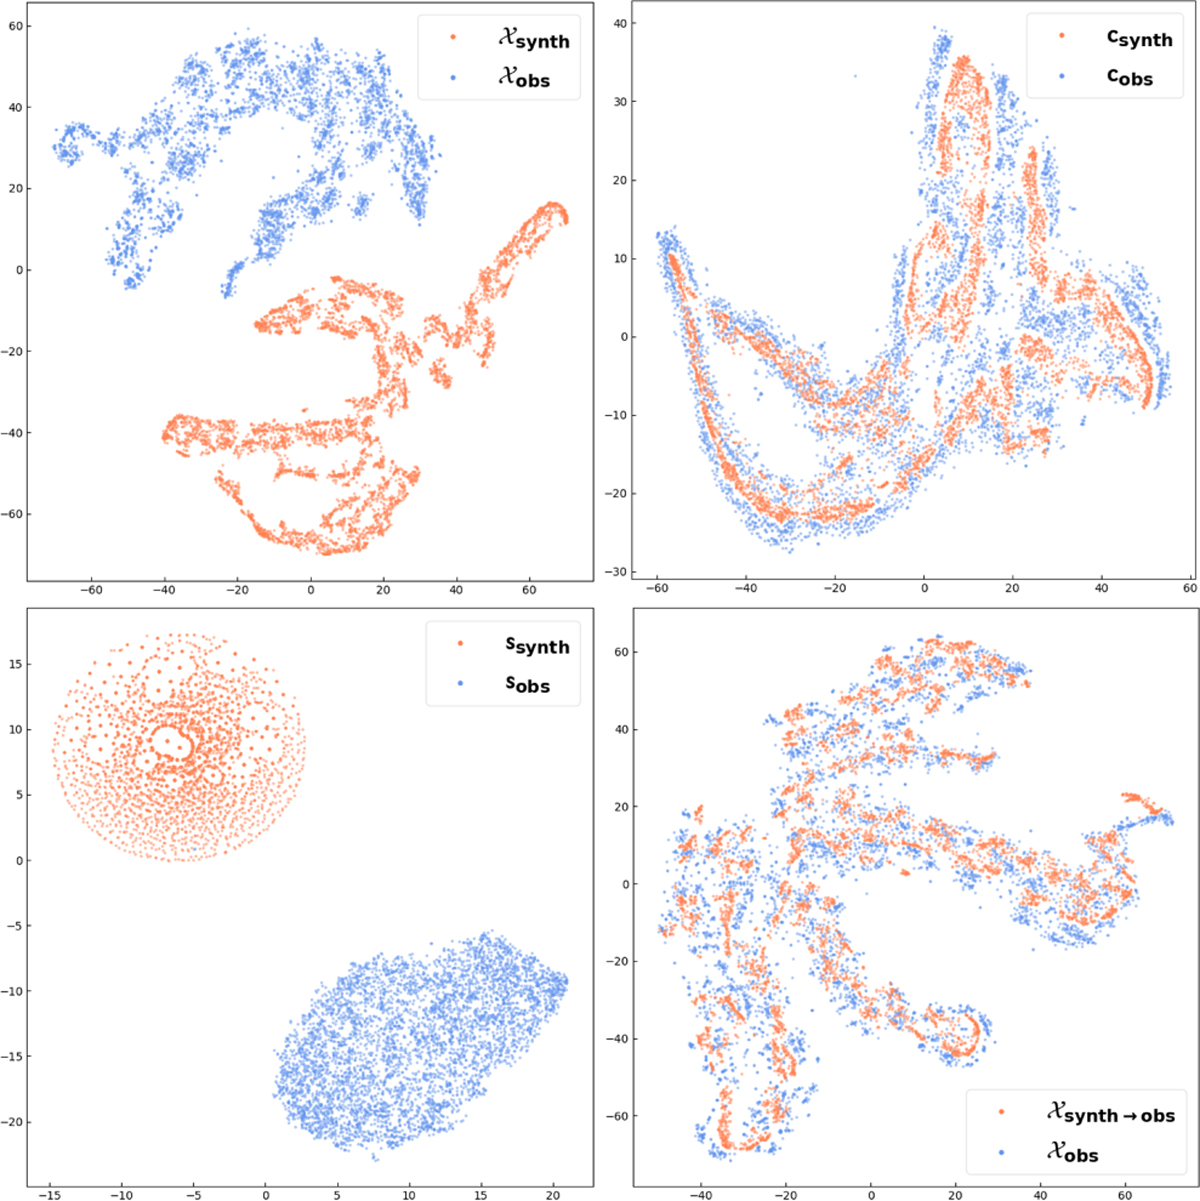
Distribution of t-SNE visualisation domain. Spectra and features are represented visually using the t-SNE algorithm. The top-left and bottom-right panels show the visualised domain distribution of the synthetic spectra and observed spectra before and after cross-domain translation. The top-right and bottom-left show the corresponding feature distributions of the synthetic spectra and observed spectra extracted by the content encoder and the style encoder. The 𝒳-axis and y-axis coordinates represent the positions of data points in the new coordinate system after dimensionality reduction. The positions after dimensionality reduction can reflect the similarity between data points.
Current usage metrics show cumulative count of Article Views (full-text article views including HTML views, PDF and ePub downloads, according to the available data) and Abstracts Views on Vision4Press platform.
Data correspond to usage on the plateform after 2015. The current usage metrics is available 48-96 hours after online publication and is updated daily on week days.
Initial download of the metrics may take a while.