Fig. 7
Download original image
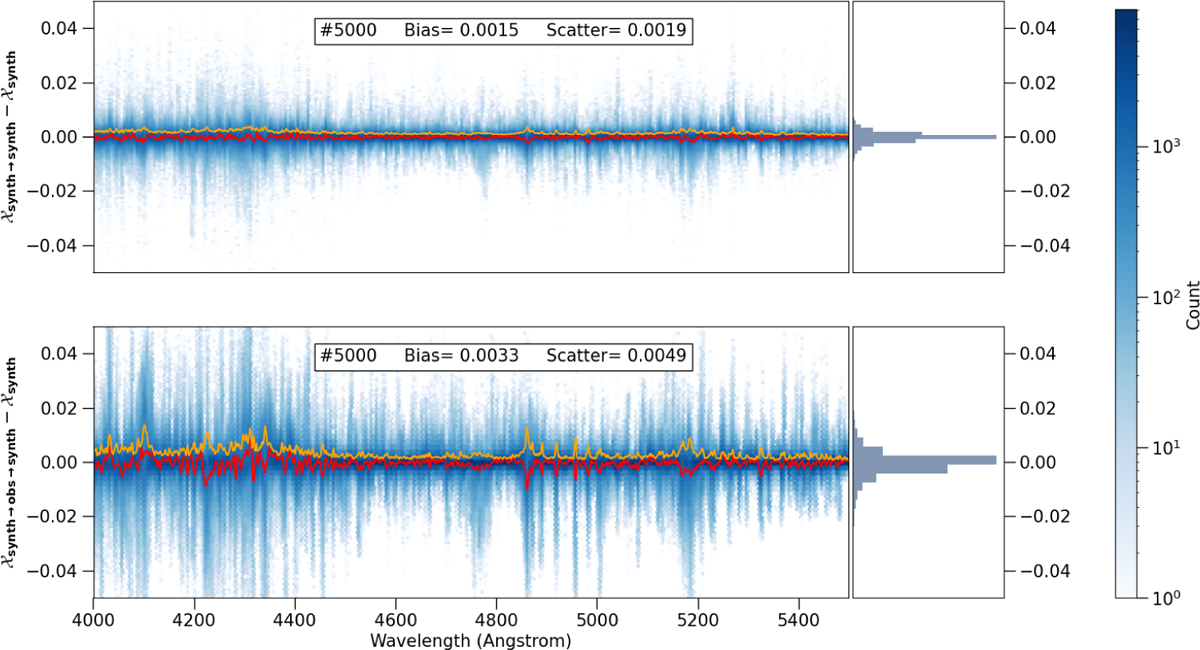
In-domain reconstruction and cycle reconstruction. This figure shows the residuals between the 5000 synthetic spectra in the test set and themselves after in-domain reconstruction and cycle reconstruction. These spectra cover most of the stellar parameter range. The blue part indicates the residuals after reconstruction of each spectrum in the wavelength range 4000–5500 Å. The colour depth is positively correlated with the number of spectra in this error. The red line in the figure indicates the average residuals, and the orange line indicates the average absolute residuals. The upper panel shows the in-domain reconstruction residuals as the relative residuals between 𝒳synth→synth and the original spectra 𝒳synth, and the lower panel shows the cycle reconstruction residuals as the relative residuals between the spectra 𝒳synth→obs→synth and the original spectra 𝒳synth. The residuals for both the in-domain and cycle reconstructions are very small and can be neglected, as can be seen in the figure.
Current usage metrics show cumulative count of Article Views (full-text article views including HTML views, PDF and ePub downloads, according to the available data) and Abstracts Views on Vision4Press platform.
Data correspond to usage on the plateform after 2015. The current usage metrics is available 48-96 hours after online publication and is updated daily on week days.
Initial download of the metrics may take a while.