Fig 14
Download original image
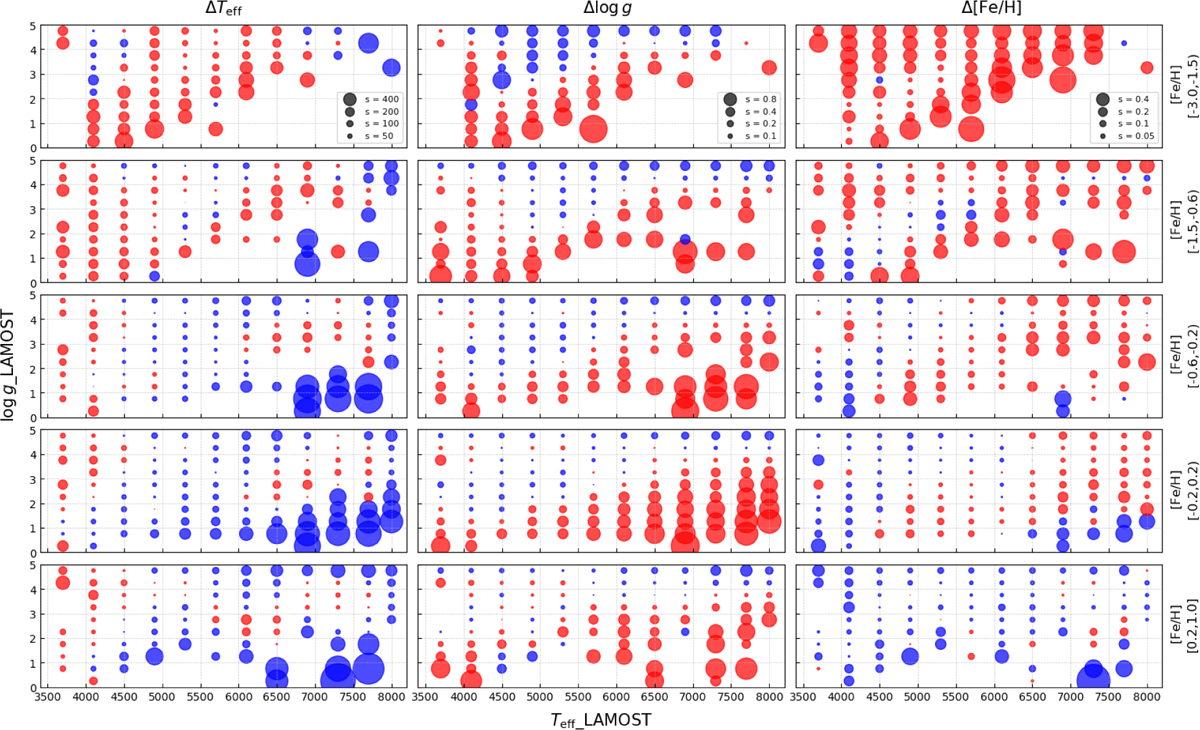
Distribution of the mean value of the difference between our results and the parameters of LAMOST DR8 in the Teff−log ɡ plane. The three columns of subplots in the figure are the Teff difference, the log ɡ difference, and the [Fe/H] difference (from left to right), and the four rows are the different [Fe/H] ranges (from top to bottom): [−3.0, −1.5), [−1.5, −0.6), [−0.6, −0.2), [−0.2, 0.2), and [0.2, 1.0]. Each dot in the figure represents the mean value obtained by summing the parameter difference of a grid with a Teff of 400k and a log ɡ of 0.5 dex size range and dividing it by the number of spectra, with the size of the dots representing the size of the difference, where red means that our results are larger than those published in LAMOST DR8 and blue means the opposite.
Current usage metrics show cumulative count of Article Views (full-text article views including HTML views, PDF and ePub downloads, according to the available data) and Abstracts Views on Vision4Press platform.
Data correspond to usage on the plateform after 2015. The current usage metrics is available 48-96 hours after online publication and is updated daily on week days.
Initial download of the metrics may take a while.