Fig. 9
Download original image
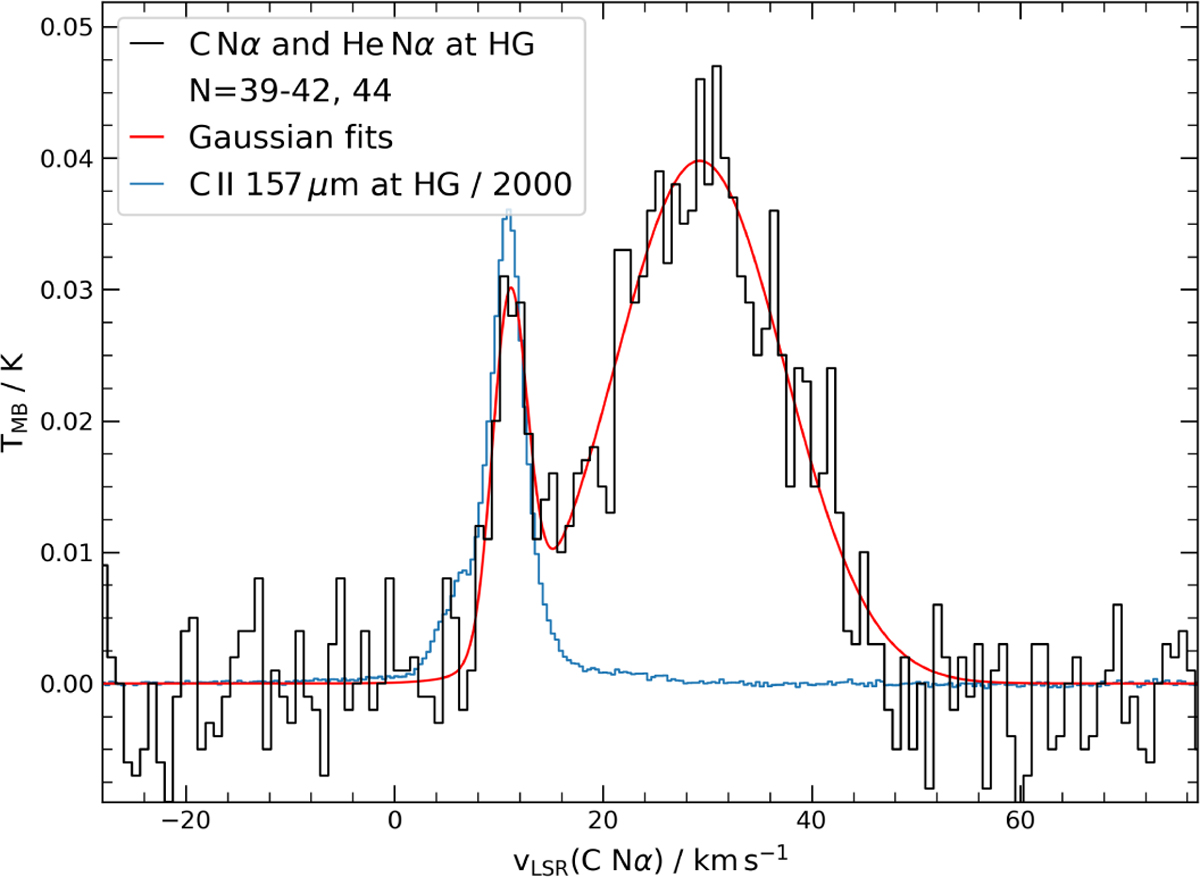
CII 157 µm transition (blue) and stacked spectra of the HeNα and CNα RRLs with N=39−42 and 44 (black) towards clump HG (Her 36). The velocity scale of the RRLs is computed based on the rest frequency of the CNα lines. The Gaussians fitted to the RRLs are displayed in red. The temperature scale of the 158 µm CII fine structure transition is divided by 2000 to compare it with the RRLs.
Current usage metrics show cumulative count of Article Views (full-text article views including HTML views, PDF and ePub downloads, according to the available data) and Abstracts Views on Vision4Press platform.
Data correspond to usage on the plateform after 2015. The current usage metrics is available 48-96 hours after online publication and is updated daily on week days.
Initial download of the metrics may take a while.