Fig. 8
Download original image
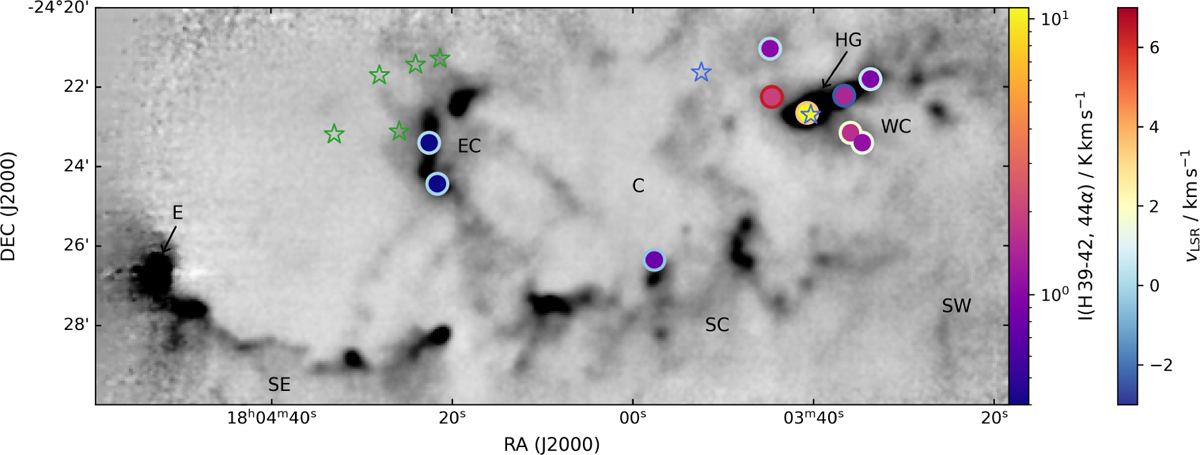
Intensity and LOS velocities of the H 39−44α transitions observed at the positions of the clumps in the Lagoon Nebula. The fillings of the coloured dots indicate the intensities and the borders describe the velocities. Blue and green stars respectively mark the positions of present O- and B-type stars. The grey-scale background image shows the JCMT SCUBA 870 µm dust continuum flux (see Fig. 2).
Current usage metrics show cumulative count of Article Views (full-text article views including HTML views, PDF and ePub downloads, according to the available data) and Abstracts Views on Vision4Press platform.
Data correspond to usage on the plateform after 2015. The current usage metrics is available 48-96 hours after online publication and is updated daily on week days.
Initial download of the metrics may take a while.