Fig. B.1
Download original image
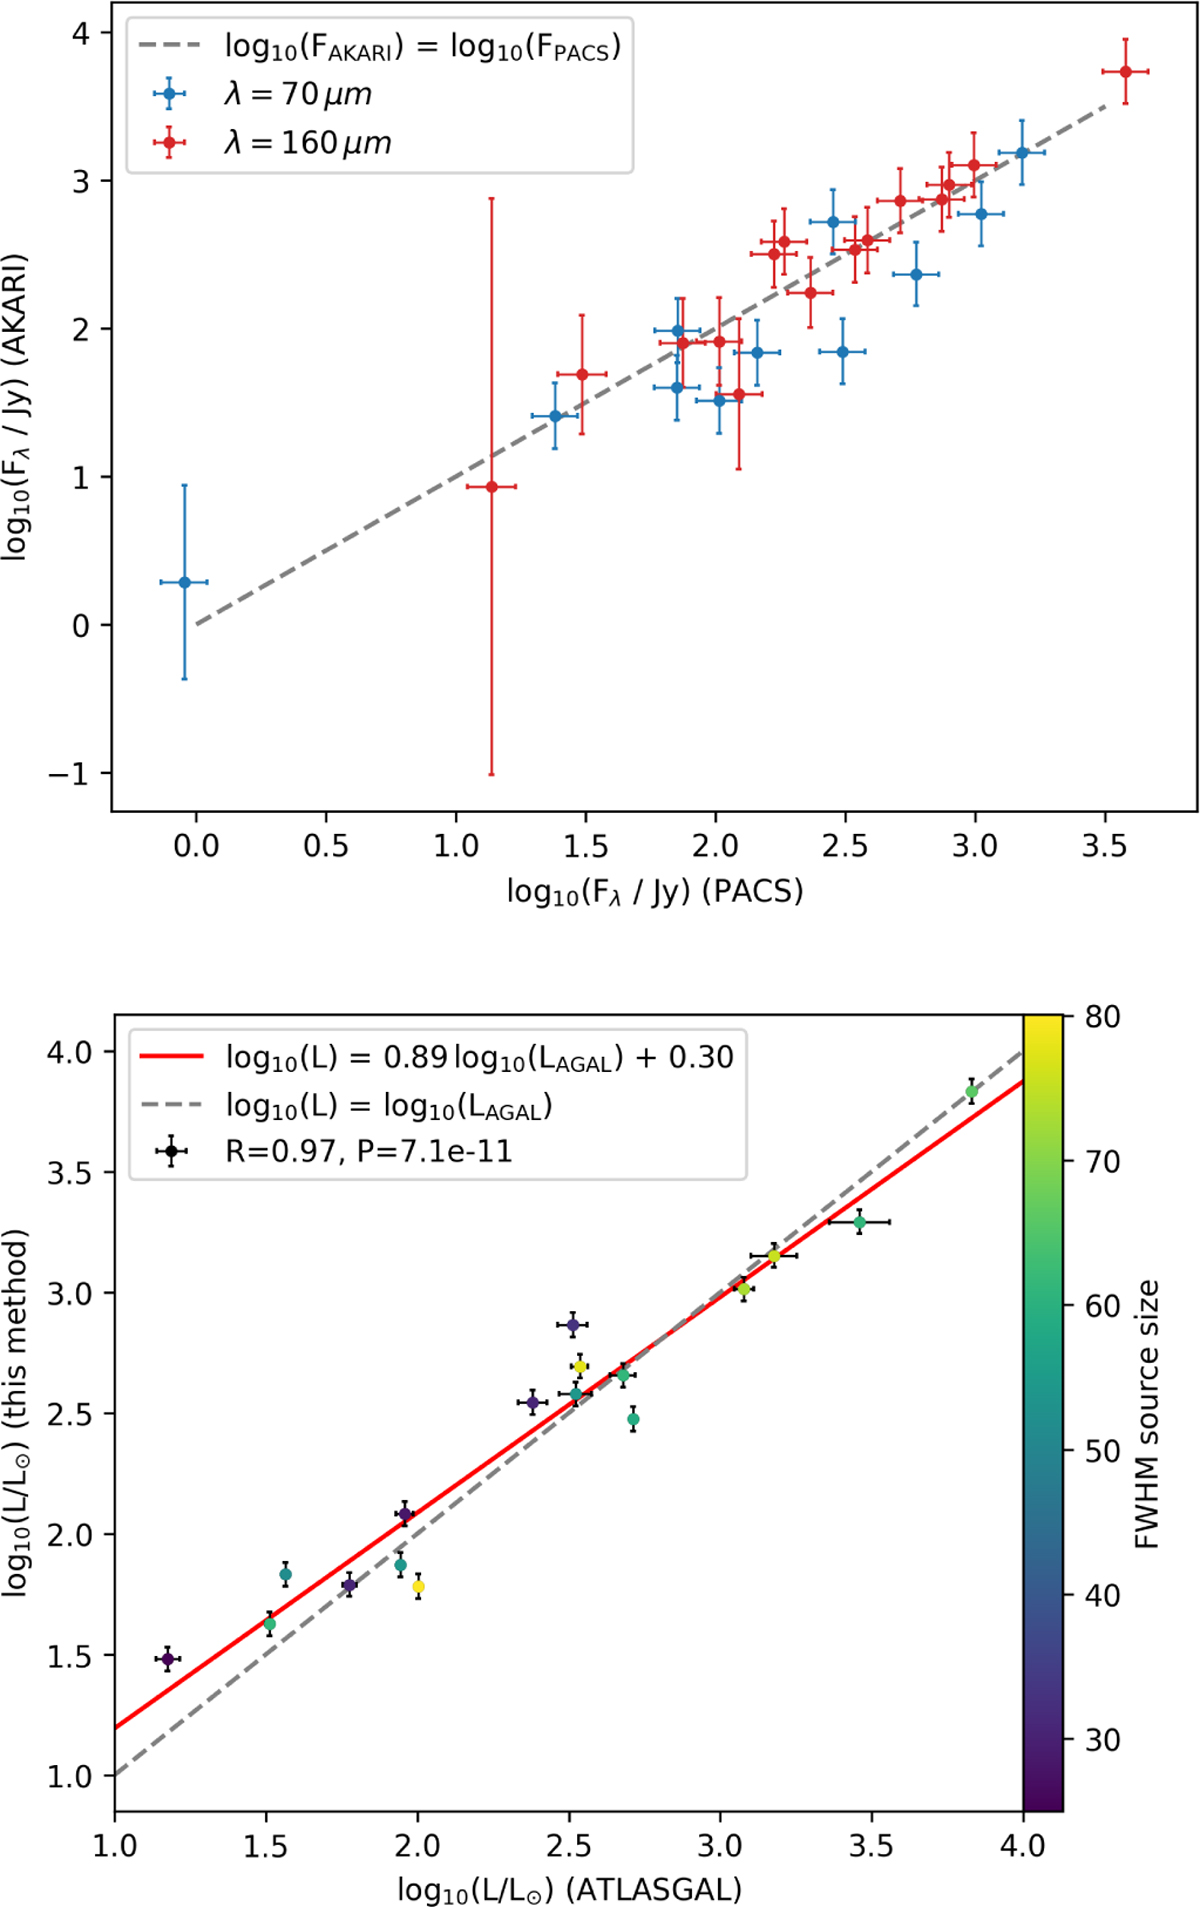
Upper panel: Comparison of the flux density extracted inside a 40.9″ beam for the AKARI and PACS images of selected clumps in NGC 6334. Lower panel: Luminosities of these clumps as derived from fitting SEDs with the AKARI data as compared to the luminosities derived by Urquhart et al. (2018) for the same clumps. The fitted linear relation and the Pearson correlation coefficient R and the P value are given in the upper-left corner.
Current usage metrics show cumulative count of Article Views (full-text article views including HTML views, PDF and ePub downloads, according to the available data) and Abstracts Views on Vision4Press platform.
Data correspond to usage on the plateform after 2015. The current usage metrics is available 48-96 hours after online publication and is updated daily on week days.
Initial download of the metrics may take a while.