Fig. A.1
Download original image
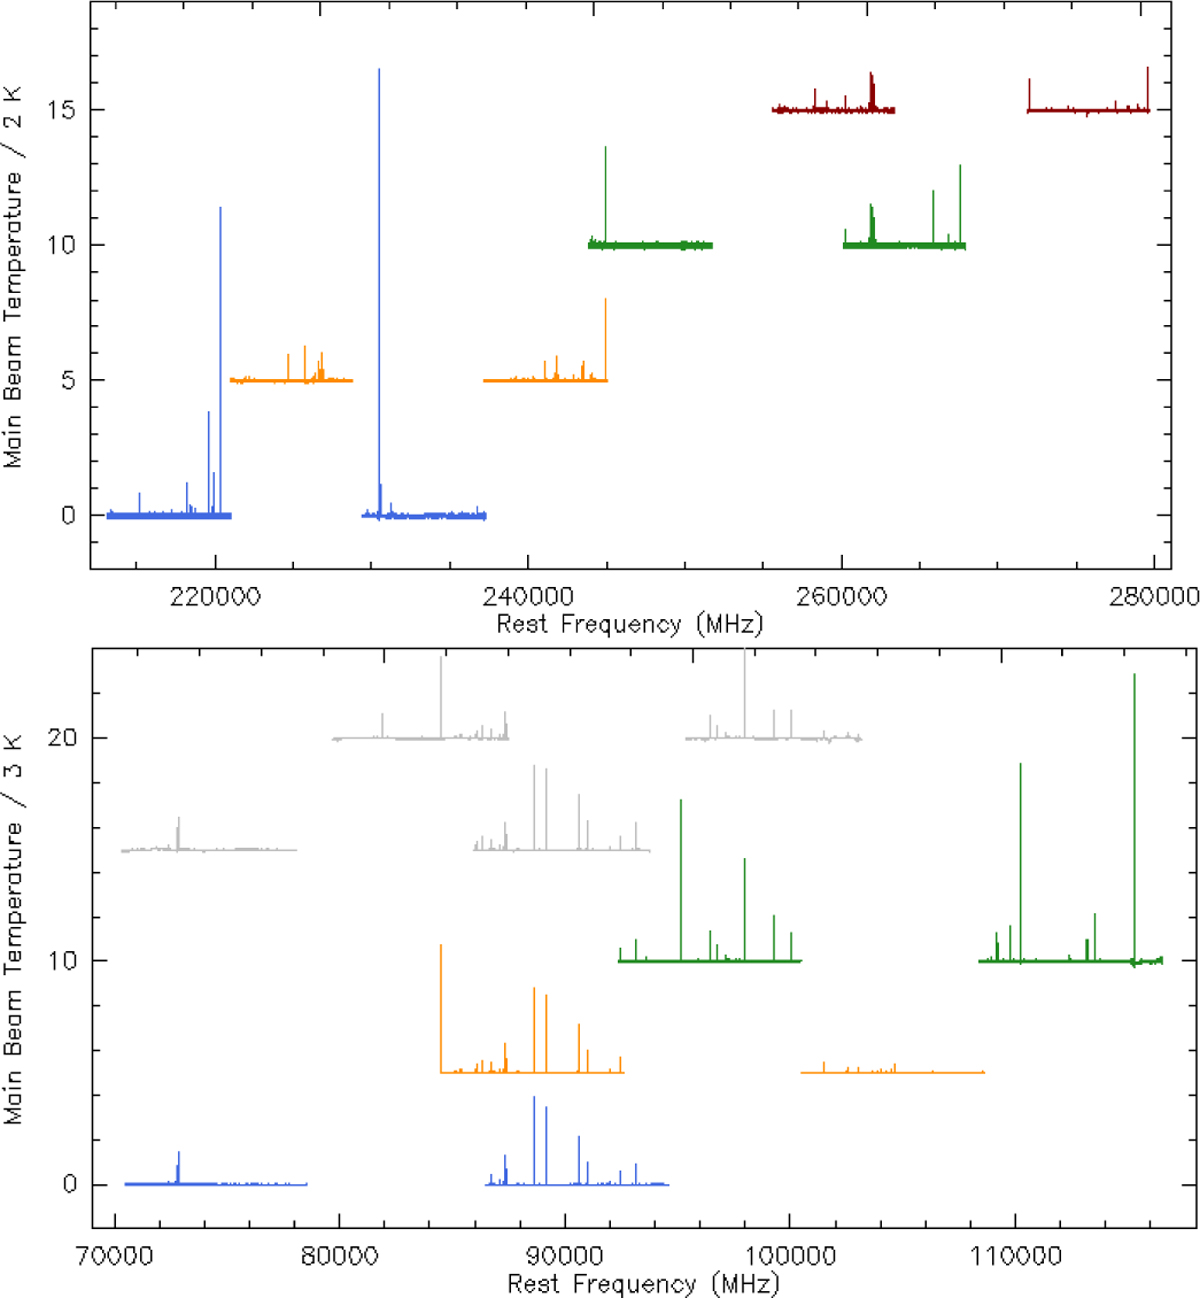
Visualisation of the frequency coverage. The spectra originate from the observations of E, which are divided by two (upper panel) or three (lower panel) and shifted on the temperature scale for illustrative purposes. Upper panel: The four setups used in the APEX observations. Lower panel: Setups (in colour) of the new observations conducted with the IRAM 30m telescope. Grey spectra show the additional frequency bands covered by the on-off observations of Tiwari et al. (2020), which are used to supplement our data at the position of clump E.
Current usage metrics show cumulative count of Article Views (full-text article views including HTML views, PDF and ePub downloads, according to the available data) and Abstracts Views on Vision4Press platform.
Data correspond to usage on the plateform after 2015. The current usage metrics is available 48-96 hours after online publication and is updated daily on week days.
Initial download of the metrics may take a while.