Open Access
Fig. 2
Download original image
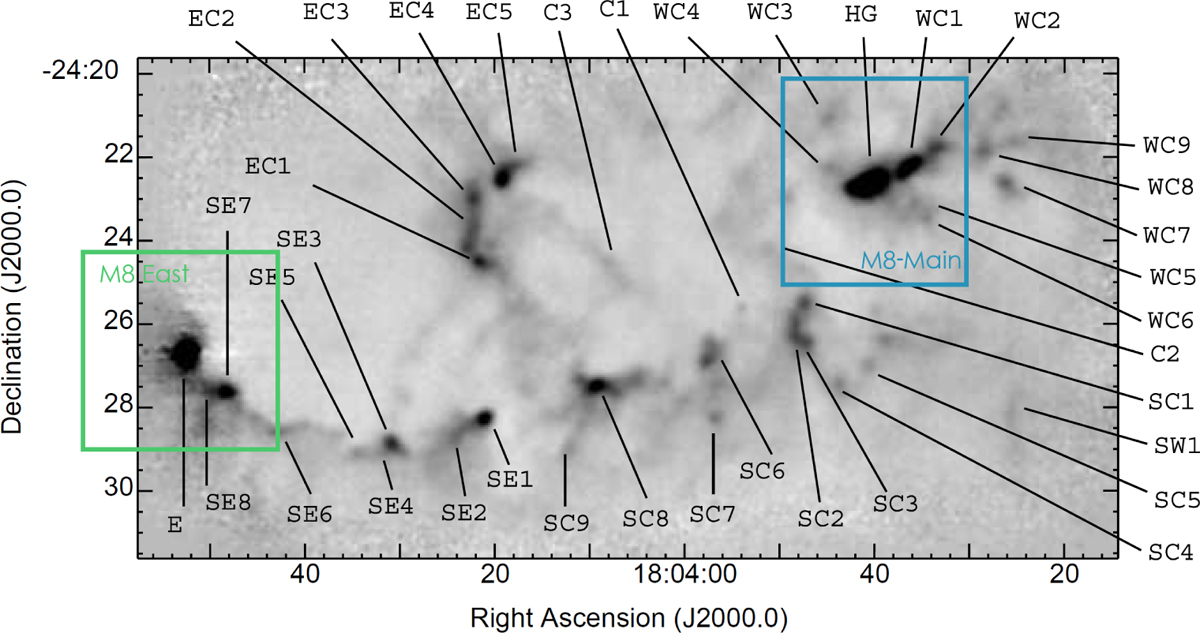
SCUBA 850 µm image of the Lagoon Nebula adapted from Tothill et al. (2002). Markers show the position of the molecular clumps in the Lagoon Nebula. The blue and green rectangles respectively indicate the regions examined by Tiwari et al. (2018) and Tiwari et al. (2020).
Current usage metrics show cumulative count of Article Views (full-text article views including HTML views, PDF and ePub downloads, according to the available data) and Abstracts Views on Vision4Press platform.
Data correspond to usage on the plateform after 2015. The current usage metrics is available 48-96 hours after online publication and is updated daily on week days.
Initial download of the metrics may take a while.