Fig. 18
Download original image
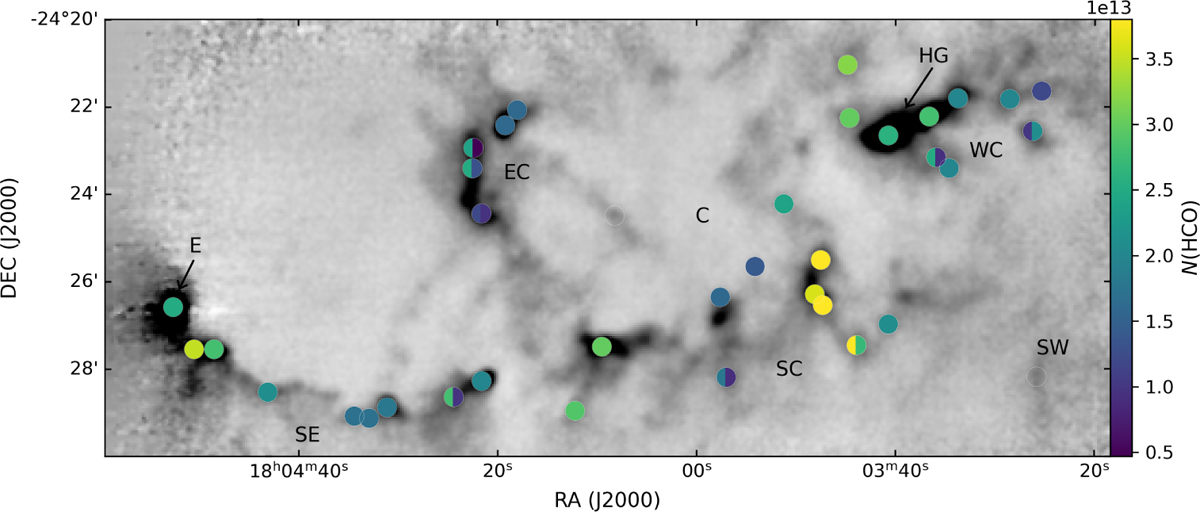
HCO column densities at the M8 clumps. The circle markers correspond to the positions of the individual clumps, with the grey-scale image showing the JCMT SCUBA 870 µm dust continuum flux (see Fig. 2). The circle size corresponds to the beam size of the on-off observations with APEX and the IRAM 30m telescope. Two-coloured circles visualise distinct velocity components observed in the same beam.
Current usage metrics show cumulative count of Article Views (full-text article views including HTML views, PDF and ePub downloads, according to the available data) and Abstracts Views on Vision4Press platform.
Data correspond to usage on the plateform after 2015. The current usage metrics is available 48-96 hours after online publication and is updated daily on week days.
Initial download of the metrics may take a while.