Fig. 16
Download original image
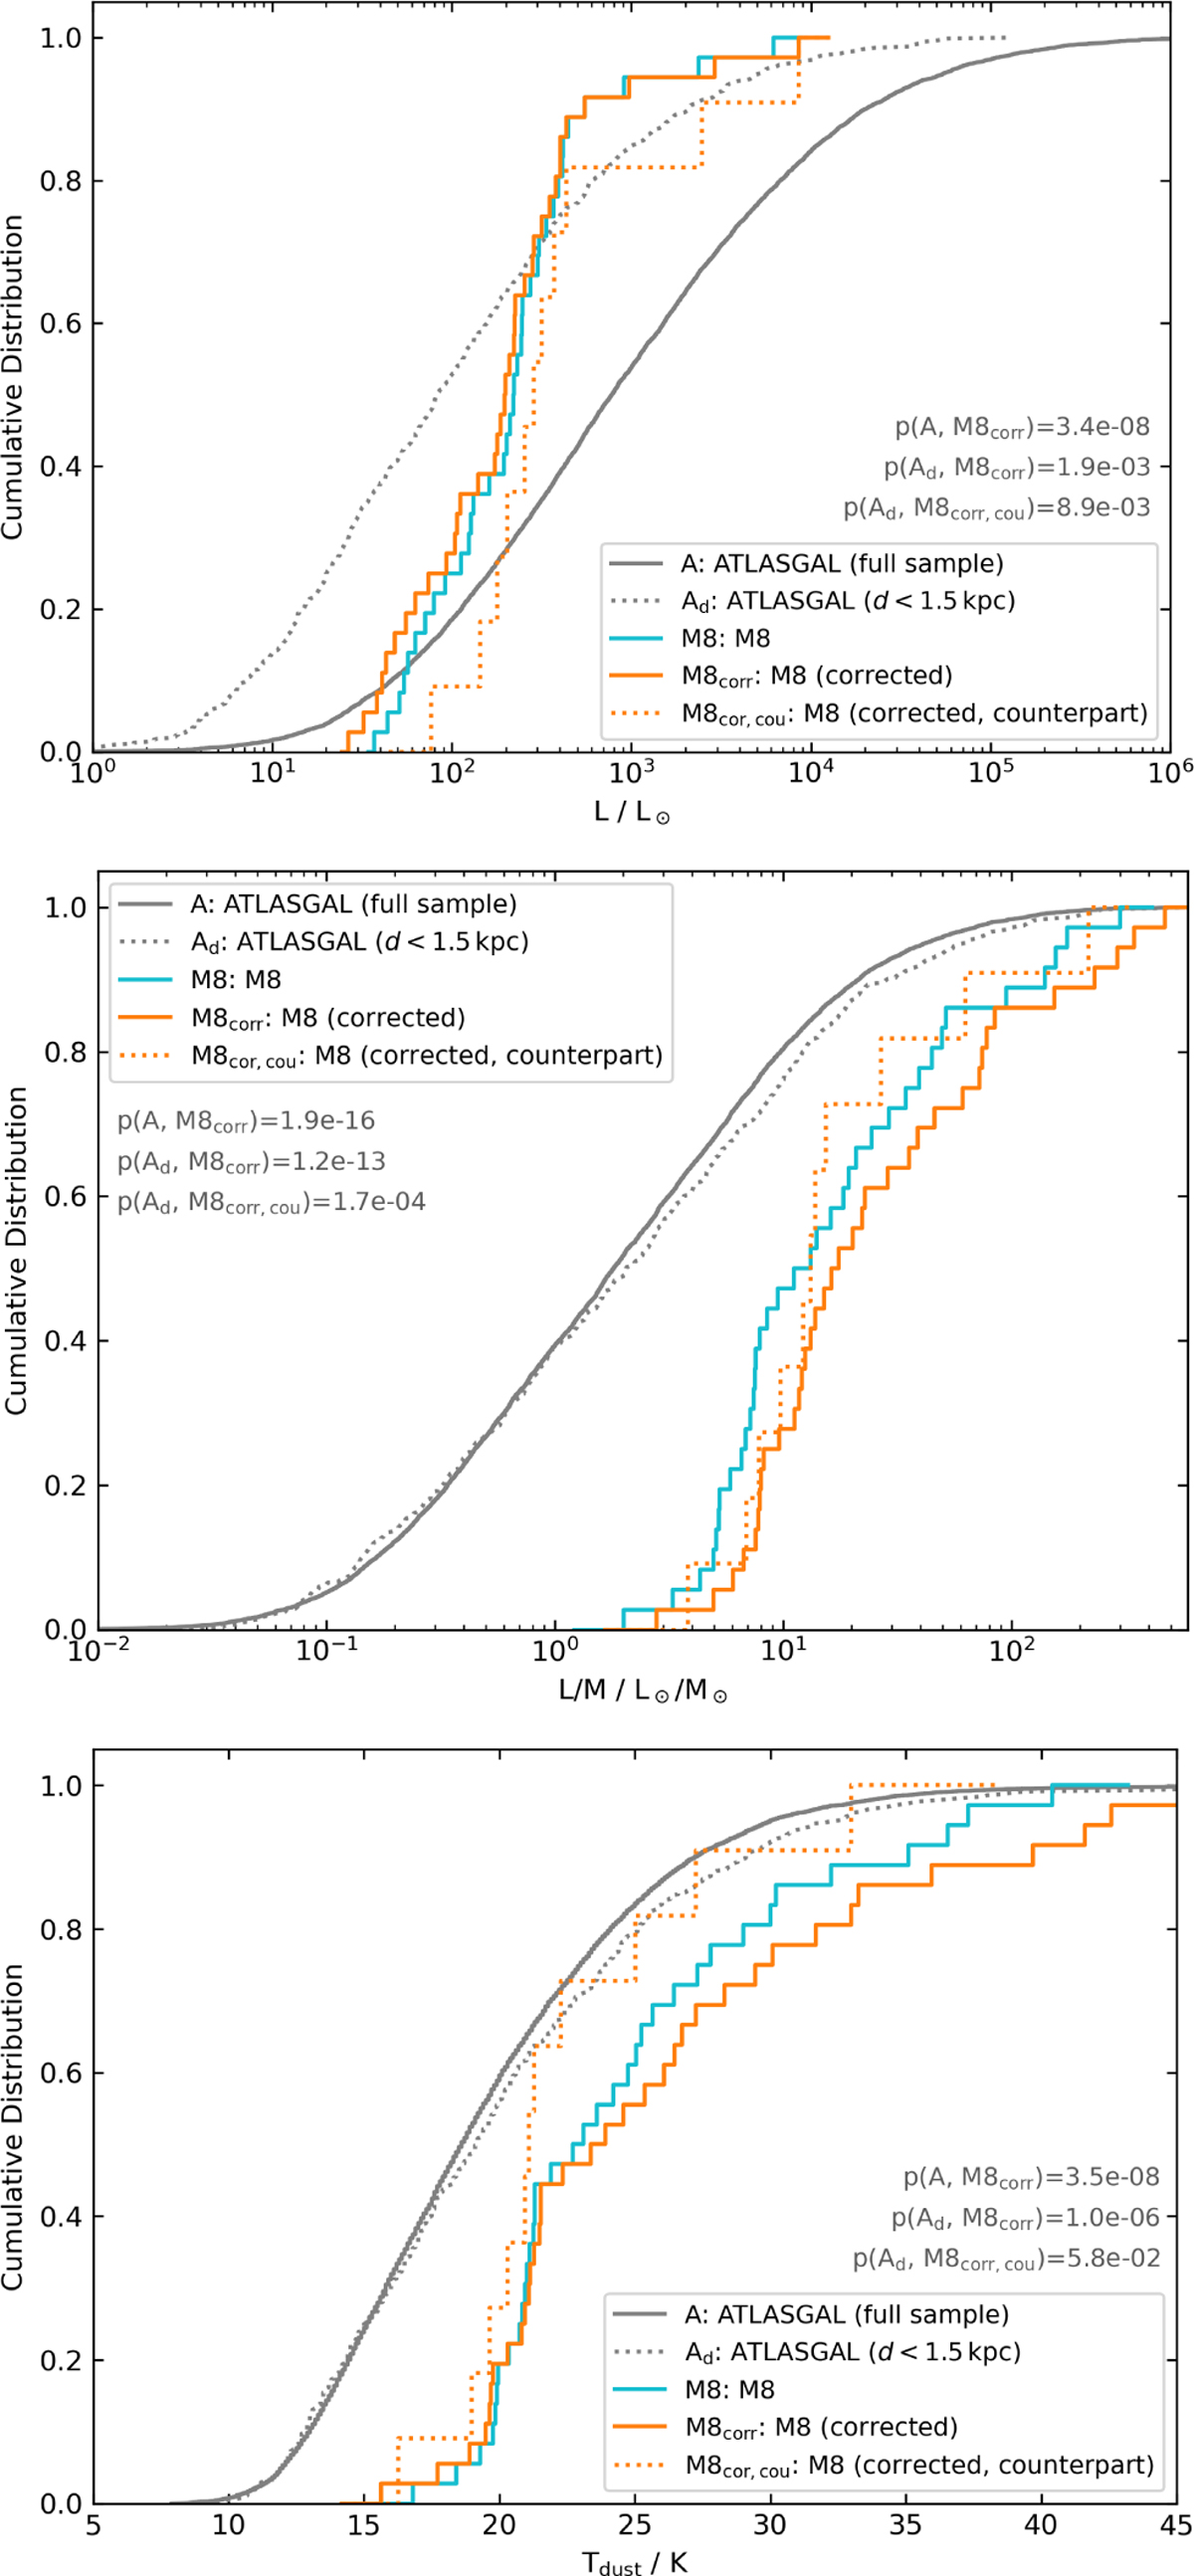
Cumulative distributions of the clump luminosities (upper panel), the L/M ratios of the respective clumps (middle panel), and clump dust temperatures (lower panel) in M8 and for sources of the full and distance-limited ATLASGAL sample. The M8 distributions shown in the orange colour are corrected based on the results of Appendix B. The dotted orange distribution only contains M8 clumps that have a nearby counterpart in the ATLASGAL sample. The p-values of KS tests between selected samples are provided as grey text.
Current usage metrics show cumulative count of Article Views (full-text article views including HTML views, PDF and ePub downloads, according to the available data) and Abstracts Views on Vision4Press platform.
Data correspond to usage on the plateform after 2015. The current usage metrics is available 48-96 hours after online publication and is updated daily on week days.
Initial download of the metrics may take a while.