Open Access
Fig. 14
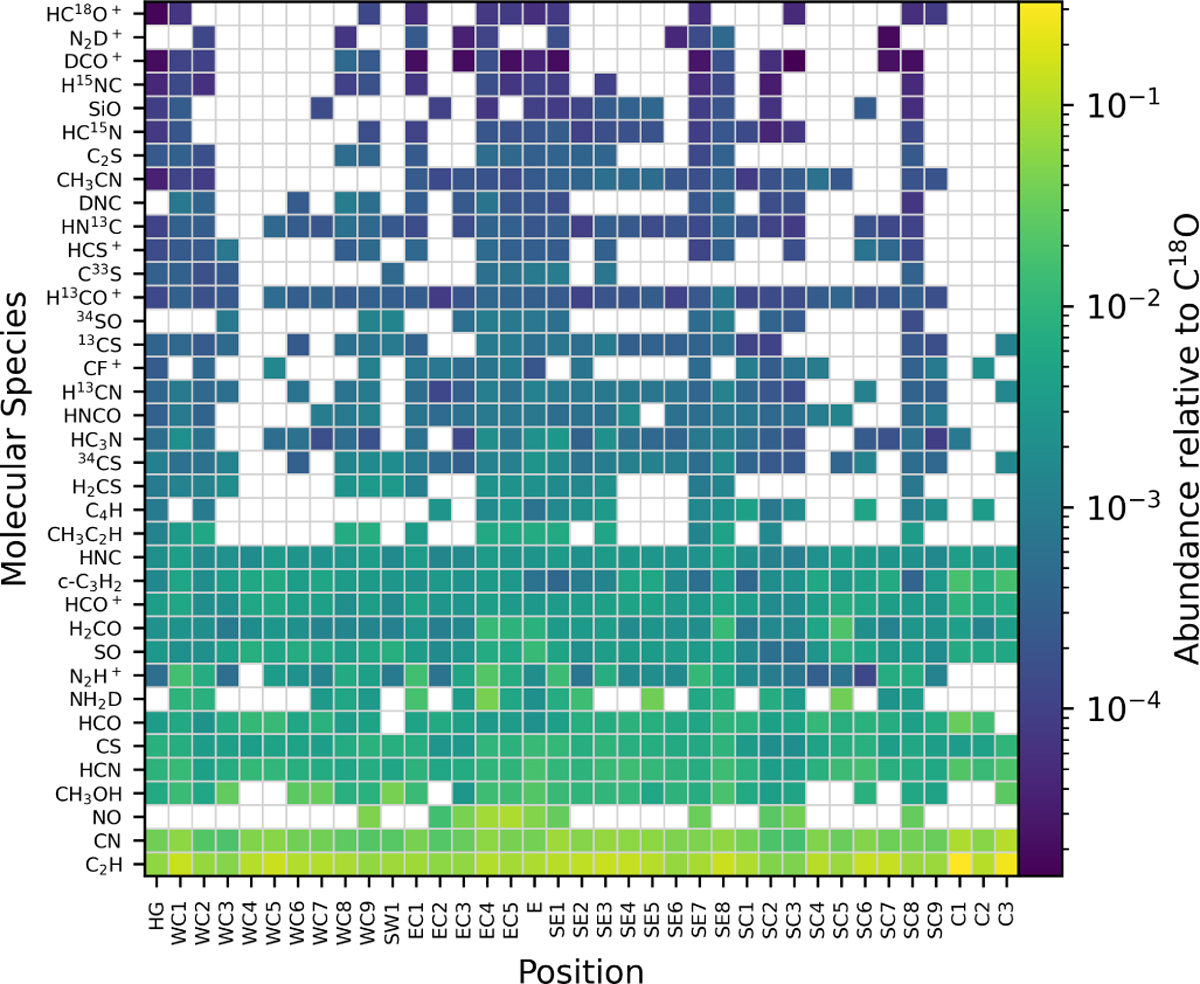
Download original image
Column densities of species detected in at least ten M8 clumps. The colour scale gives the relative abundance of a respective species to the column density of C18O at the same position. White cells indicate the non-detection of a species in the associated clump.
Current usage metrics show cumulative count of Article Views (full-text article views including HTML views, PDF and ePub downloads, according to the available data) and Abstracts Views on Vision4Press platform.
Data correspond to usage on the plateform after 2015. The current usage metrics is available 48-96 hours after online publication and is updated daily on week days.
Initial download of the metrics may take a while.