Open Access
Fig. 12
Download original image
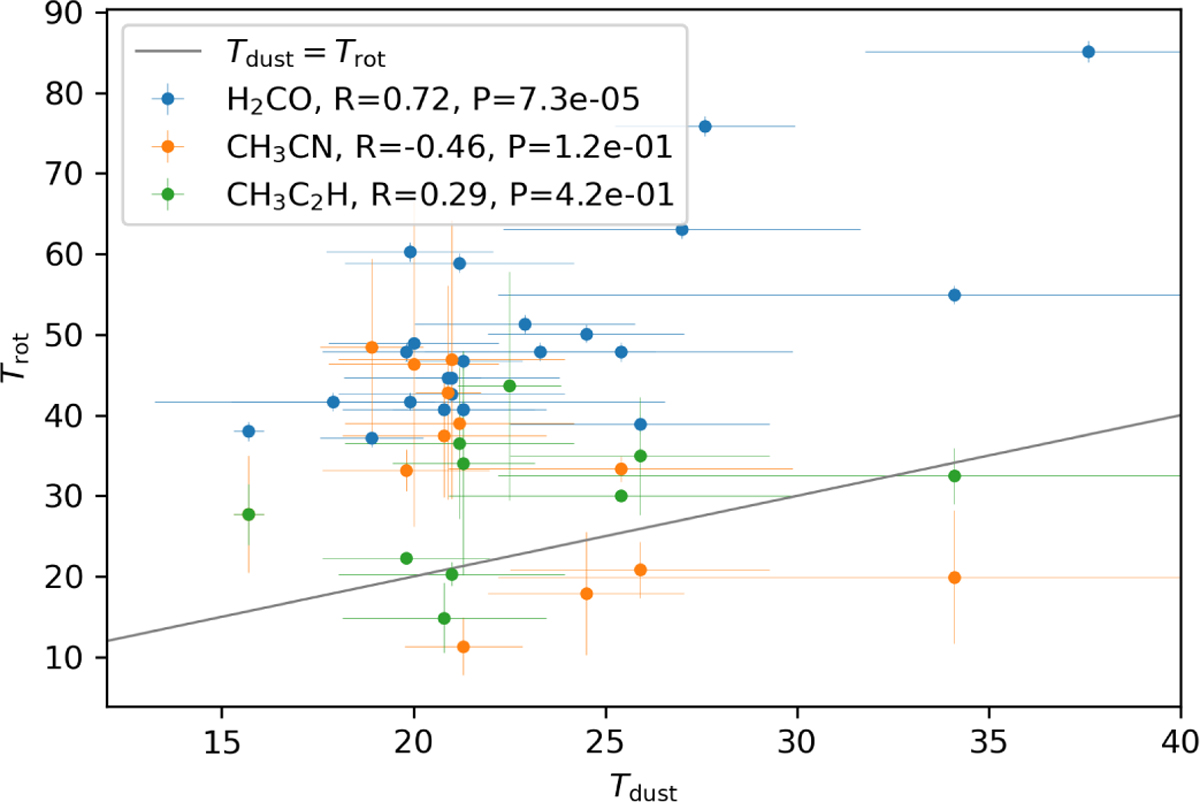
Temperatures derived from the rotational transitions of paraformaldehyde, acetonitrile, and methyl acetylene as a function of dust temperatures at the clumps in M8. The legend in the upper-left corner provides the Pearson correlation coefficient R and the P values for the respective samples.
Current usage metrics show cumulative count of Article Views (full-text article views including HTML views, PDF and ePub downloads, according to the available data) and Abstracts Views on Vision4Press platform.
Data correspond to usage on the plateform after 2015. The current usage metrics is available 48-96 hours after online publication and is updated daily on week days.
Initial download of the metrics may take a while.