Open Access
Fig. 10
Download original image
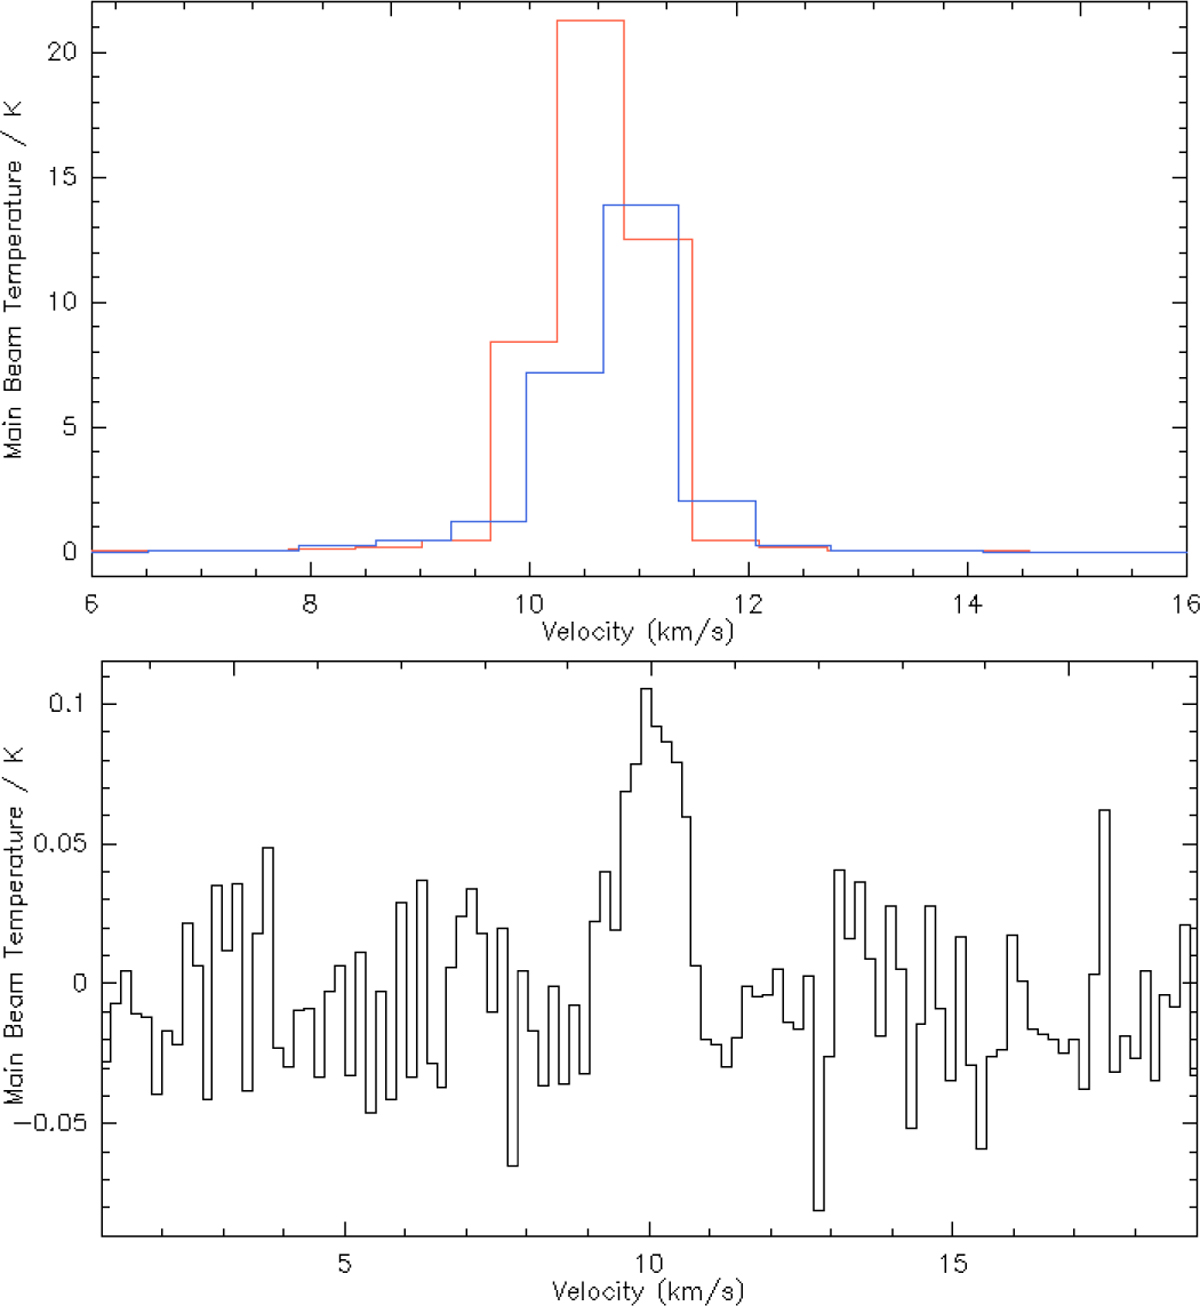
Typical line profiles of the discussed maser transitions. Upper panel: methanol maser emission of the 84.5 GHz and 95.2 GHz transitions at clump E, respectively shown in blue and red. Lower panel: maser emission of the 218.4 GHz transition at the position of SE7.
Current usage metrics show cumulative count of Article Views (full-text article views including HTML views, PDF and ePub downloads, according to the available data) and Abstracts Views on Vision4Press platform.
Data correspond to usage on the plateform after 2015. The current usage metrics is available 48-96 hours after online publication and is updated daily on week days.
Initial download of the metrics may take a while.