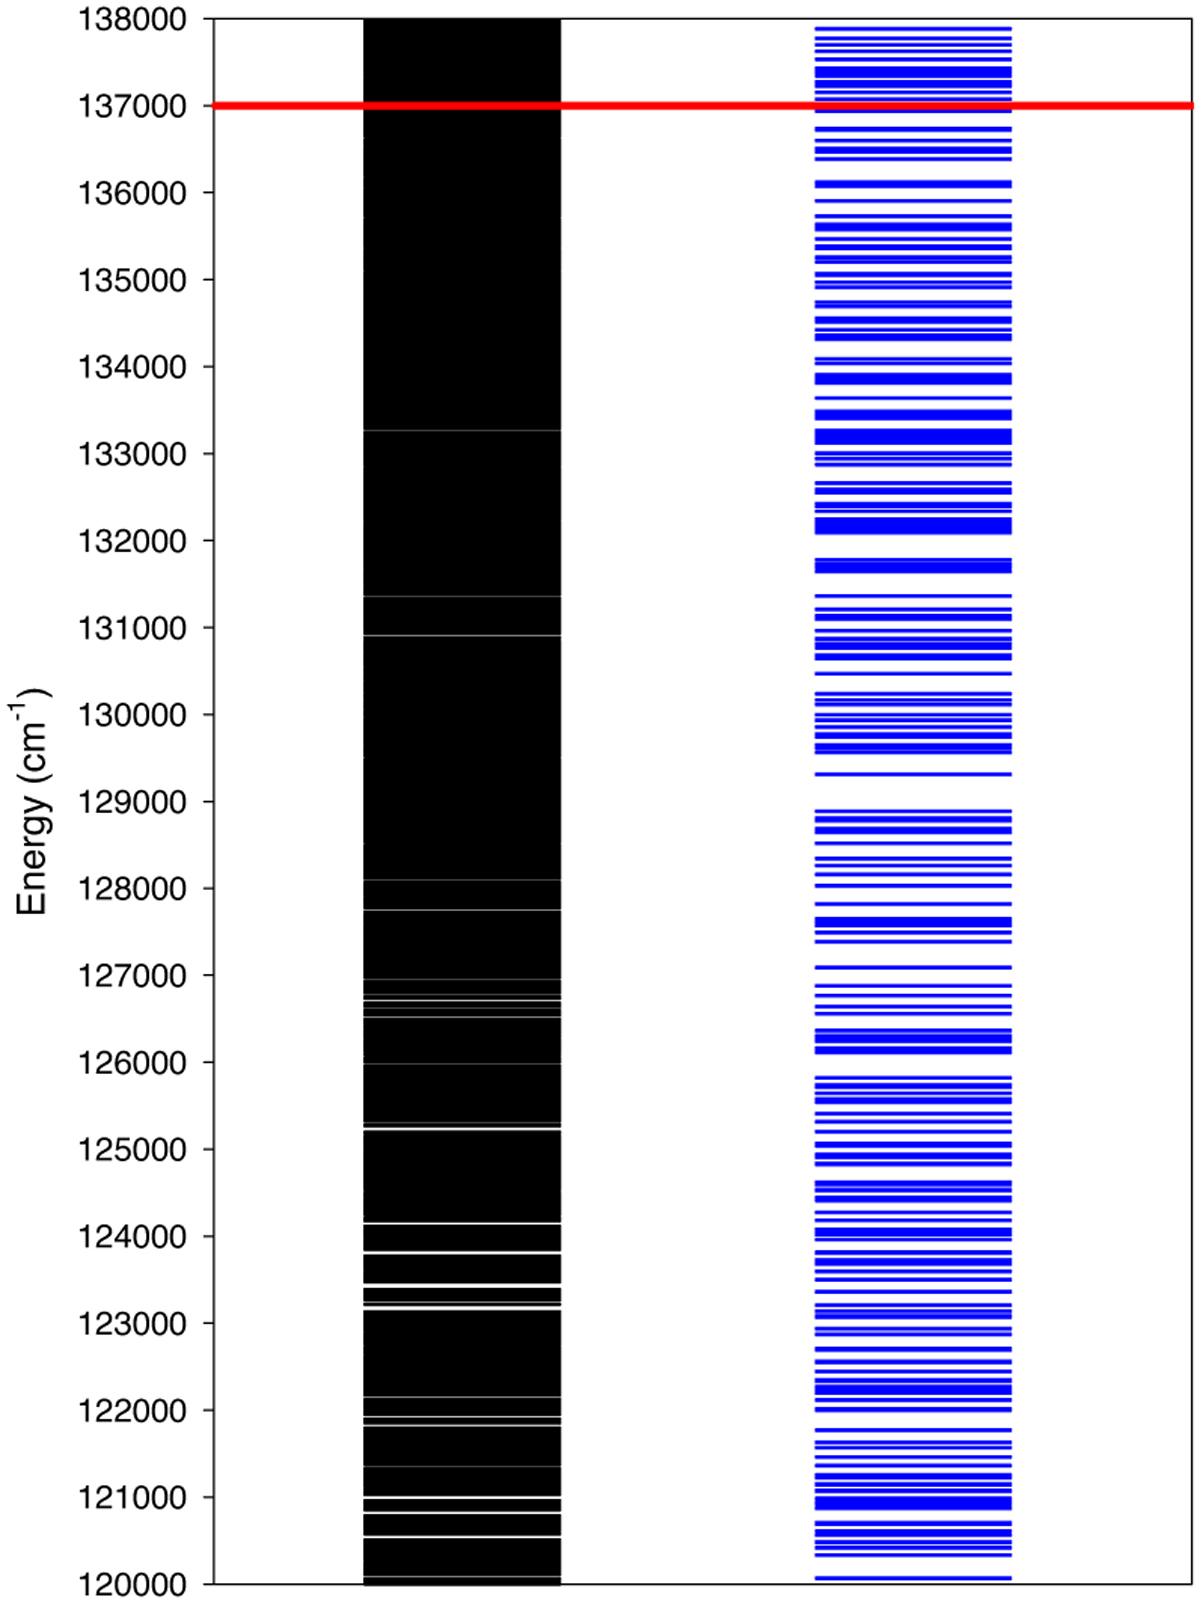
Fig. 2
Download original image
Comparison between full set of HFR energy levels calculated using physical models of present work (in black) and HFR energy levels obtained using physical models considered by Tanaka et al. (2020) (in blue) for Os II between 120 000 and 138 000 cm−1. The red line corresponds to the ionization potential taken from the NIST database (Kramida et al. 2023).
Current usage metrics show cumulative count of Article Views (full-text article views including HTML views, PDF and ePub downloads, according to the available data) and Abstracts Views on Vision4Press platform.
Data correspond to usage on the plateform after 2015. The current usage metrics is available 48-96 hours after online publication and is updated daily on week days.
Initial download of the metrics may take a while.