Fig. 8.
Download original image
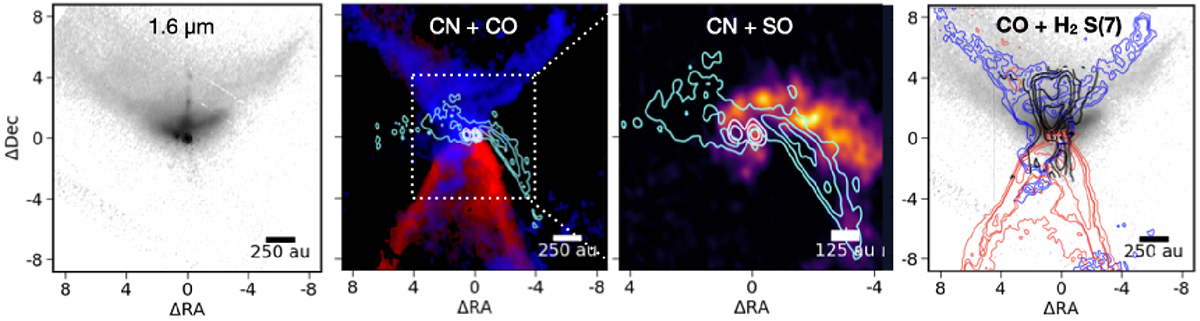
HST NICMOS 1.6 μm image of the TMC1 system (far-left). ALMA CO (2–1) blueshifted and redshifted integrated emission in colorscale, ALMA 1.3 mm continuum in white contours, and CN peak emission map (moment 8) in cyan contours (center-left). ALMA SO (6–5) integrated emission map in colorscale (center-right). NICMOS 1.6 μm image in colorscale with ALMA CO(2–1) overlaid in red and blue contours, and H2 S(7) moment 0 map in black contours (far-right).
Current usage metrics show cumulative count of Article Views (full-text article views including HTML views, PDF and ePub downloads, according to the available data) and Abstracts Views on Vision4Press platform.
Data correspond to usage on the plateform after 2015. The current usage metrics is available 48-96 hours after online publication and is updated daily on week days.
Initial download of the metrics may take a while.