Fig. 7.
Download original image
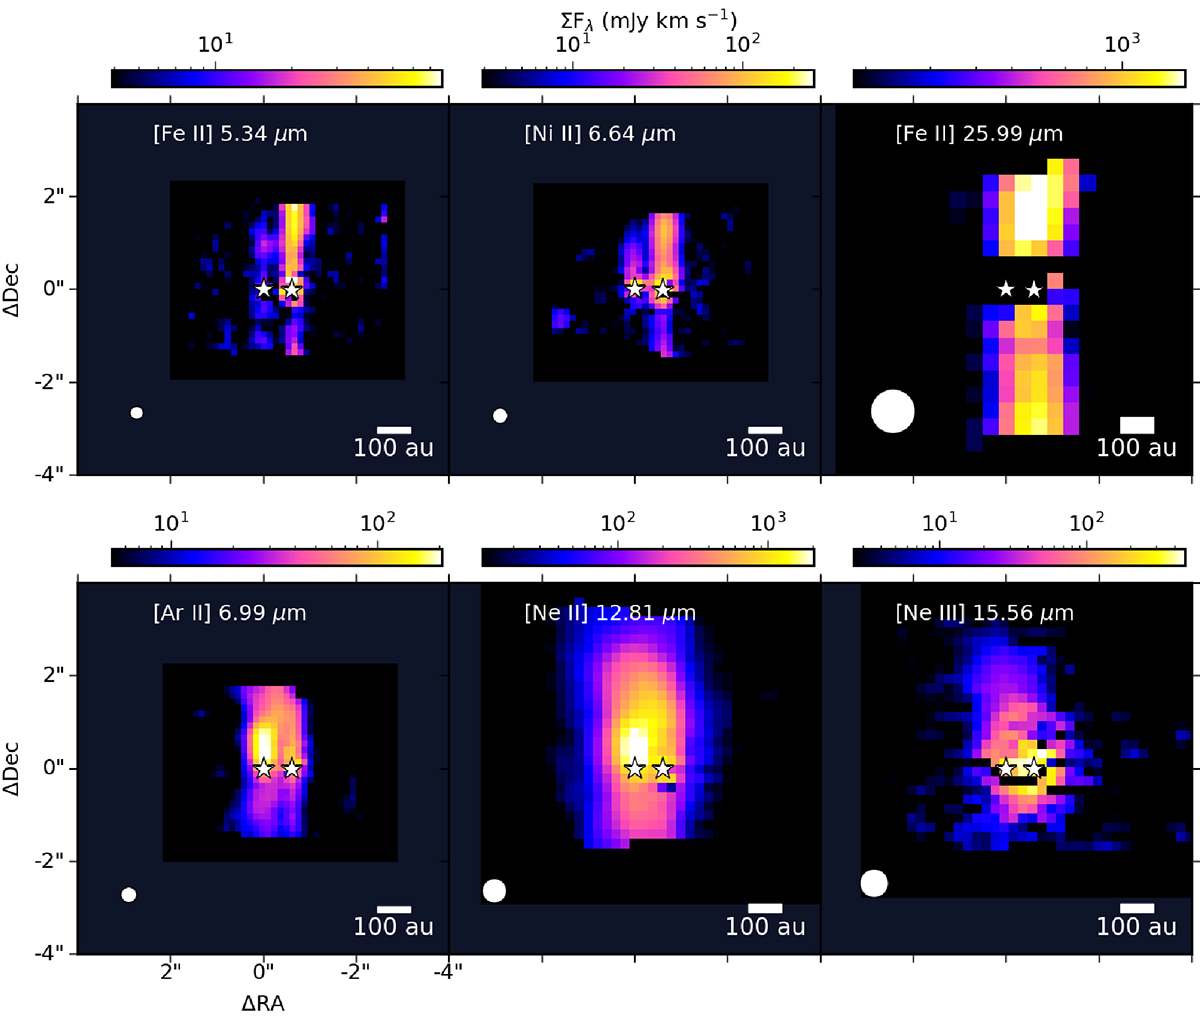
Integrated emission maps of selected emission lines of ionized species. Integrated emission maps are created from the cubes after subtracting the local continuum. Positions of the protostars measured from the line-free region at 5 μm are shown with white stars. Maps are centered on the position of the TMC1-W source. Bottom-left corners: MIRI-MRS empirical FWHM of PSF (Law et al. 2023) indicated as a white circle.
Current usage metrics show cumulative count of Article Views (full-text article views including HTML views, PDF and ePub downloads, according to the available data) and Abstracts Views on Vision4Press platform.
Data correspond to usage on the plateform after 2015. The current usage metrics is available 48-96 hours after online publication and is updated daily on week days.
Initial download of the metrics may take a while.