Fig. 6.
Download original image
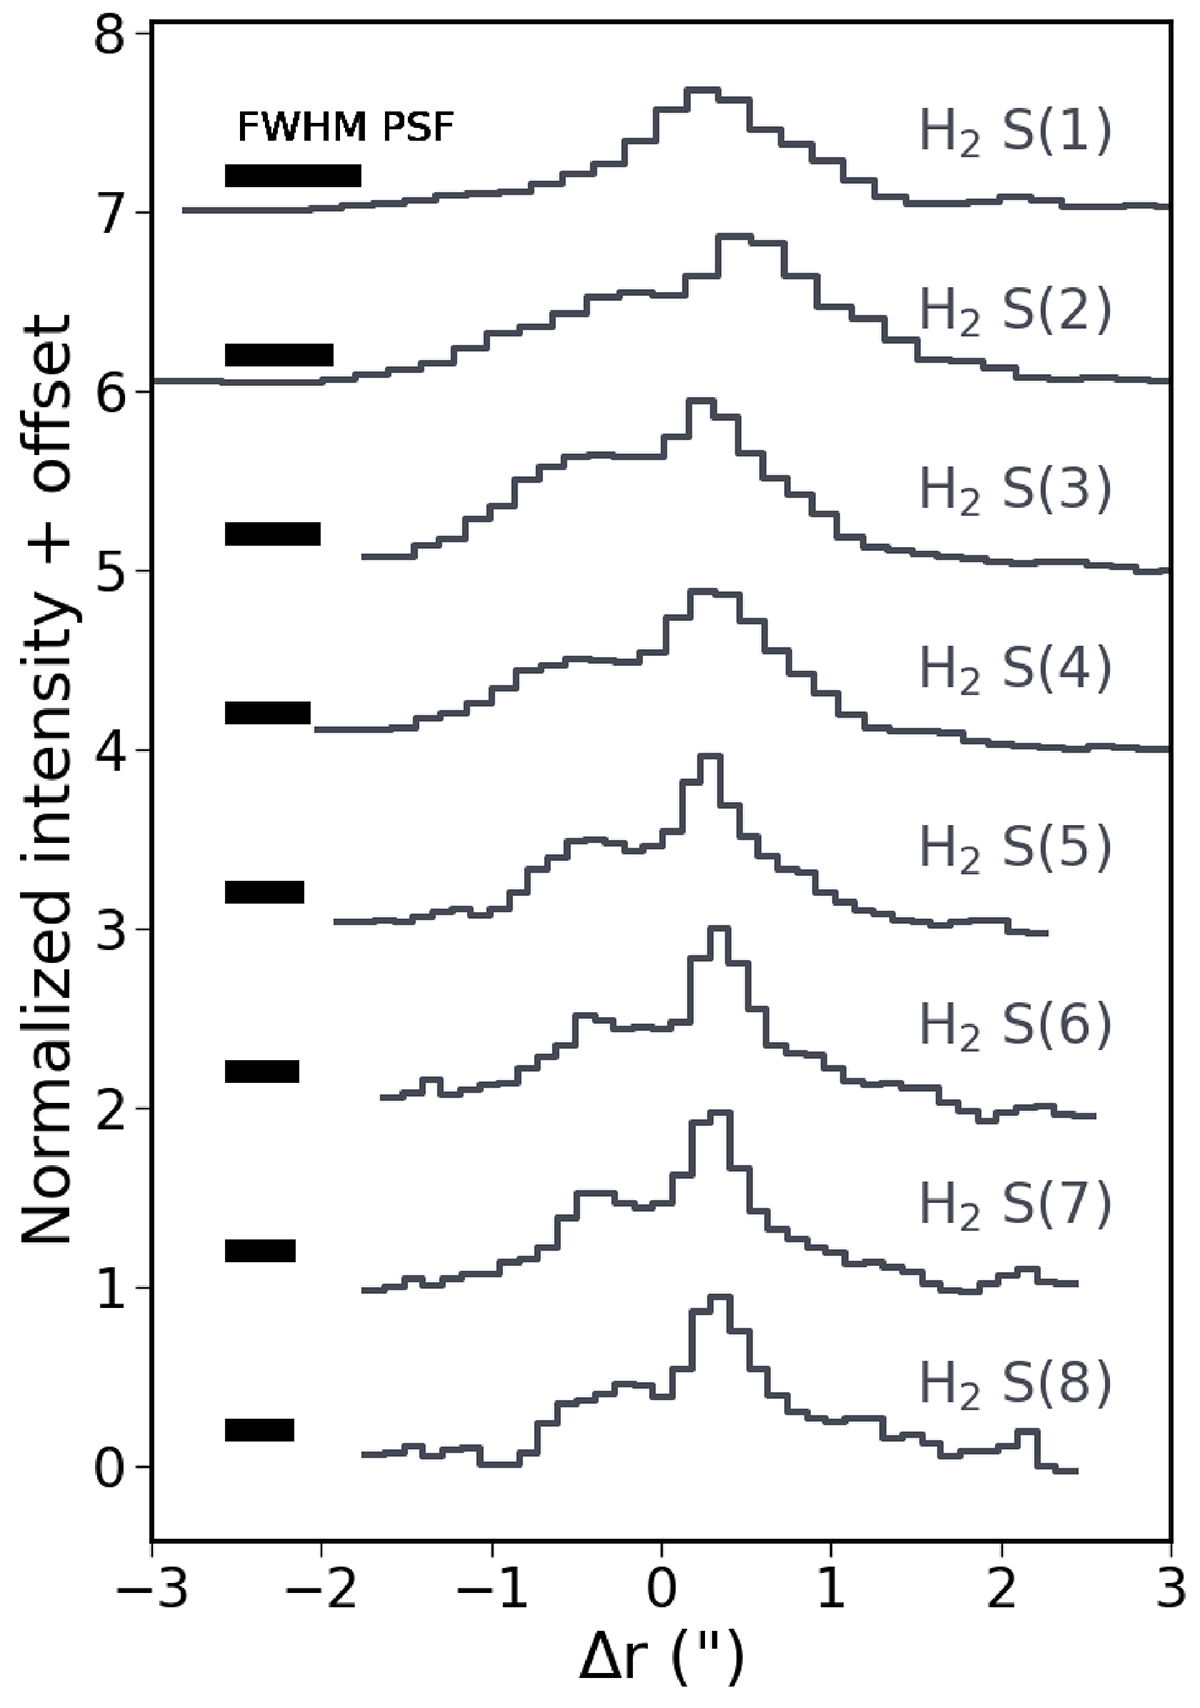
Radial cuts across the TMC1-E outflow at 1![]() 5 distance from the protostar for each of the H2 (0–0) transitions, with upper energy levels increasing from top to bottom. The reference is set to the protostar position. The position of the cut is shown in Fig. 5. The black bar shows the size of the FWHM of instrumental PSF, as described in Argyriou et al. (2023).
5 distance from the protostar for each of the H2 (0–0) transitions, with upper energy levels increasing from top to bottom. The reference is set to the protostar position. The position of the cut is shown in Fig. 5. The black bar shows the size of the FWHM of instrumental PSF, as described in Argyriou et al. (2023).
Current usage metrics show cumulative count of Article Views (full-text article views including HTML views, PDF and ePub downloads, according to the available data) and Abstracts Views on Vision4Press platform.
Data correspond to usage on the plateform after 2015. The current usage metrics is available 48-96 hours after online publication and is updated daily on week days.
Initial download of the metrics may take a while.