Open Access
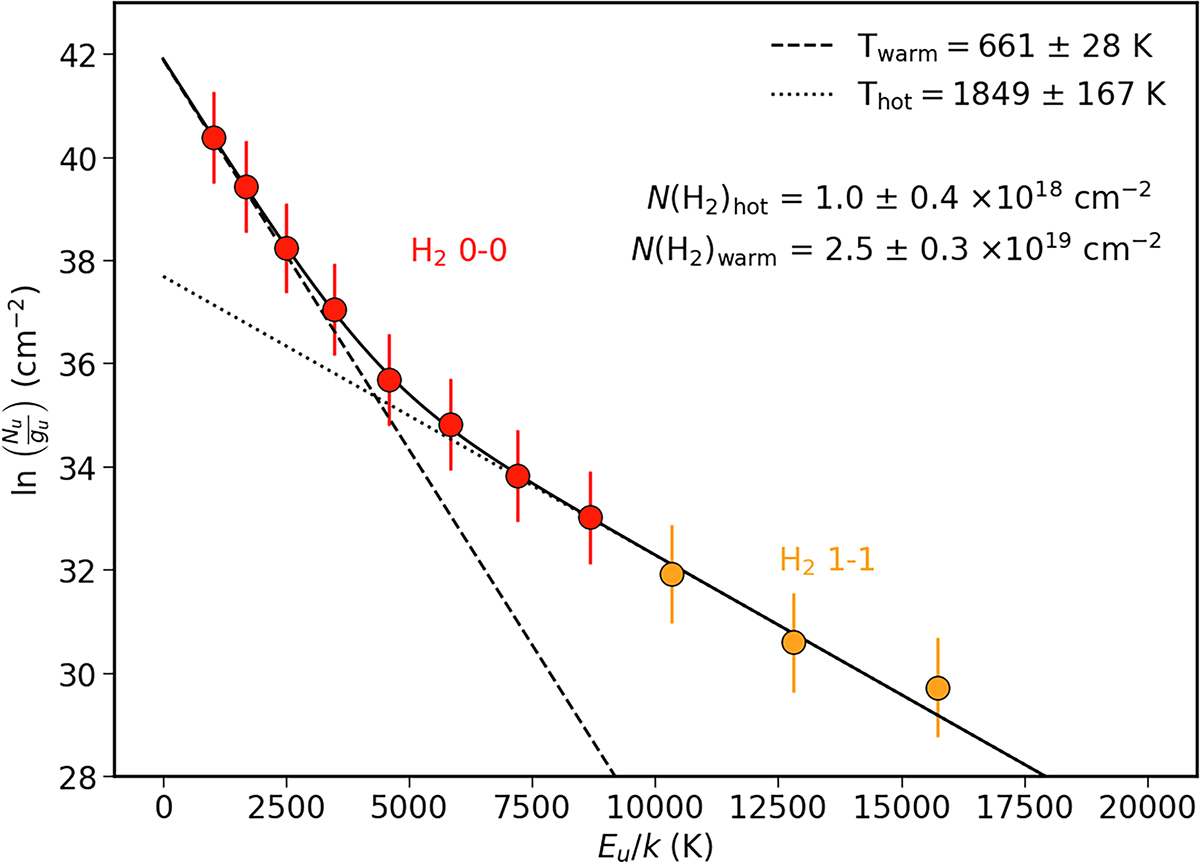
Fig. 4.
Download original image
H2 rotational diagram obtained with line intensities measured at the TMC1-E wind position. All detected H2 transitions are presented, but only v = 0–0 (red) transitions are used to fit the temperature.
Current usage metrics show cumulative count of Article Views (full-text article views including HTML views, PDF and ePub downloads, according to the available data) and Abstracts Views on Vision4Press platform.
Data correspond to usage on the plateform after 2015. The current usage metrics is available 48-96 hours after online publication and is updated daily on week days.
Initial download of the metrics may take a while.