Fig. 12.
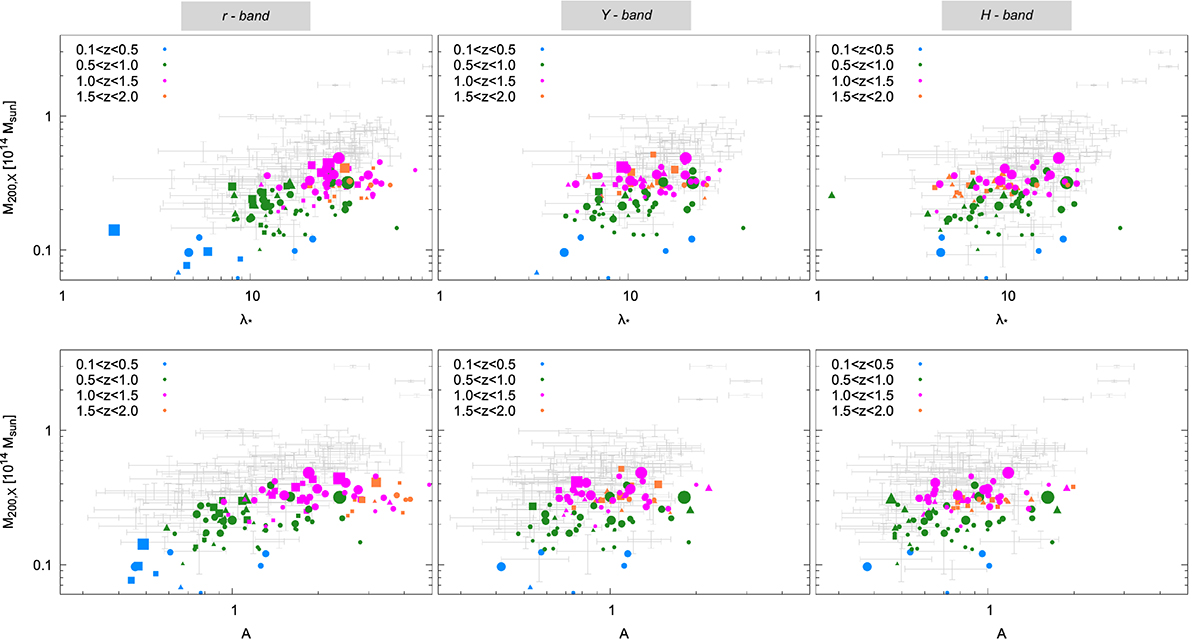
Download original image
Same as in Fig. 10, but for the sample of new detections with X-ray flux estimates selected for the scaling relation study (coloured points) in the full redshift range, z ∈ [0.1, 2.0]. From left to right: detections from analysis in the r-, Y-, and H-band. The different colours refer to the different redshift bins, as labelled in each panel. Circles are detections found in all three runs, triangles are found in two out of three runs, and squares indicate the unique detections from respective runs. The size of the symbols is proportional to the X-ray flux significance. As a reference, the grey error bars in the background indicate the detections used for the scaling relation derived from the direct matches with the X-ray catalogue (the same displayed in Fig. 10).
Current usage metrics show cumulative count of Article Views (full-text article views including HTML views, PDF and ePub downloads, according to the available data) and Abstracts Views on Vision4Press platform.
Data correspond to usage on the plateform after 2015. The current usage metrics is available 48-96 hours after online publication and is updated daily on week days.
Initial download of the metrics may take a while.