Fig. 10.
Download original image
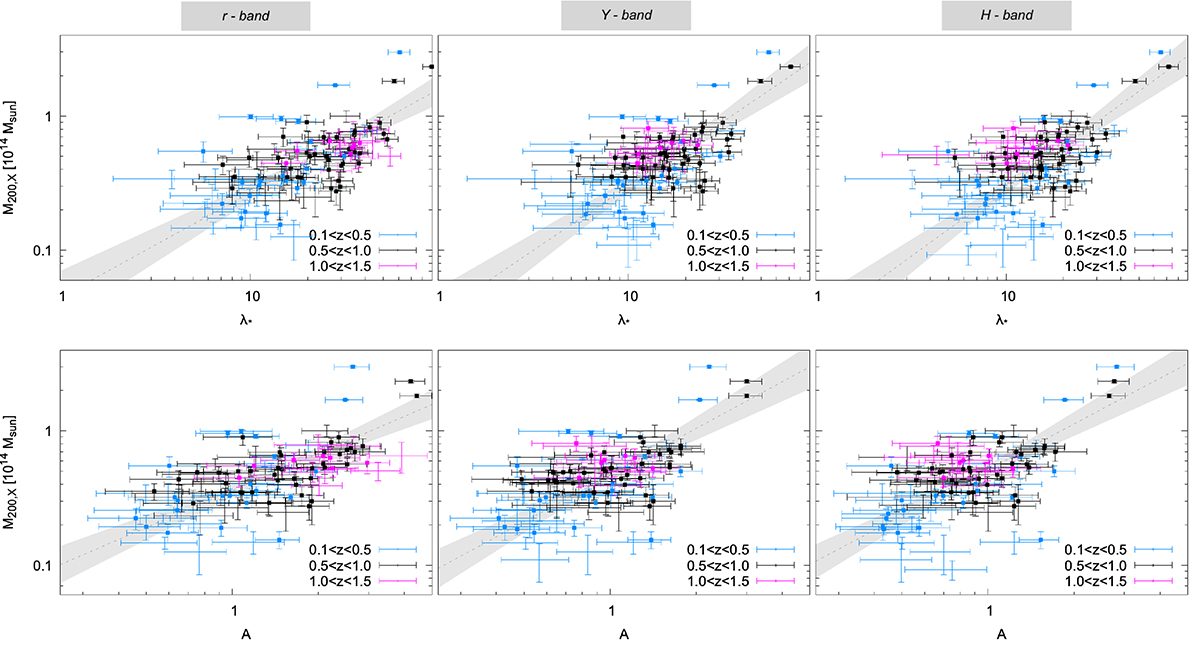
Relation between X-ray mass and richness (top panels) or amplitude (bottom panels) for the X-ray matched clusters in the catalogue by Gozaliasl et al. (2019) in the range z ∈ [0.1, 1.5]. From left to right: detections retrieved from analysis in r-, Y-, and H-band. The different colours refer to different redshift bins (see legend). The grey dashed line and shaded area indicate the best-fitting relation with the corresponding 1σ errors. Data points marked by squares are the detections belonging to the safest sample in the X-ray catalogue and without foreground, background, or nearby contamination. Error bar points without a central square are matched detections not used for the scaling relation calibration.
Current usage metrics show cumulative count of Article Views (full-text article views including HTML views, PDF and ePub downloads, according to the available data) and Abstracts Views on Vision4Press platform.
Data correspond to usage on the plateform after 2015. The current usage metrics is available 48-96 hours after online publication and is updated daily on week days.
Initial download of the metrics may take a while.