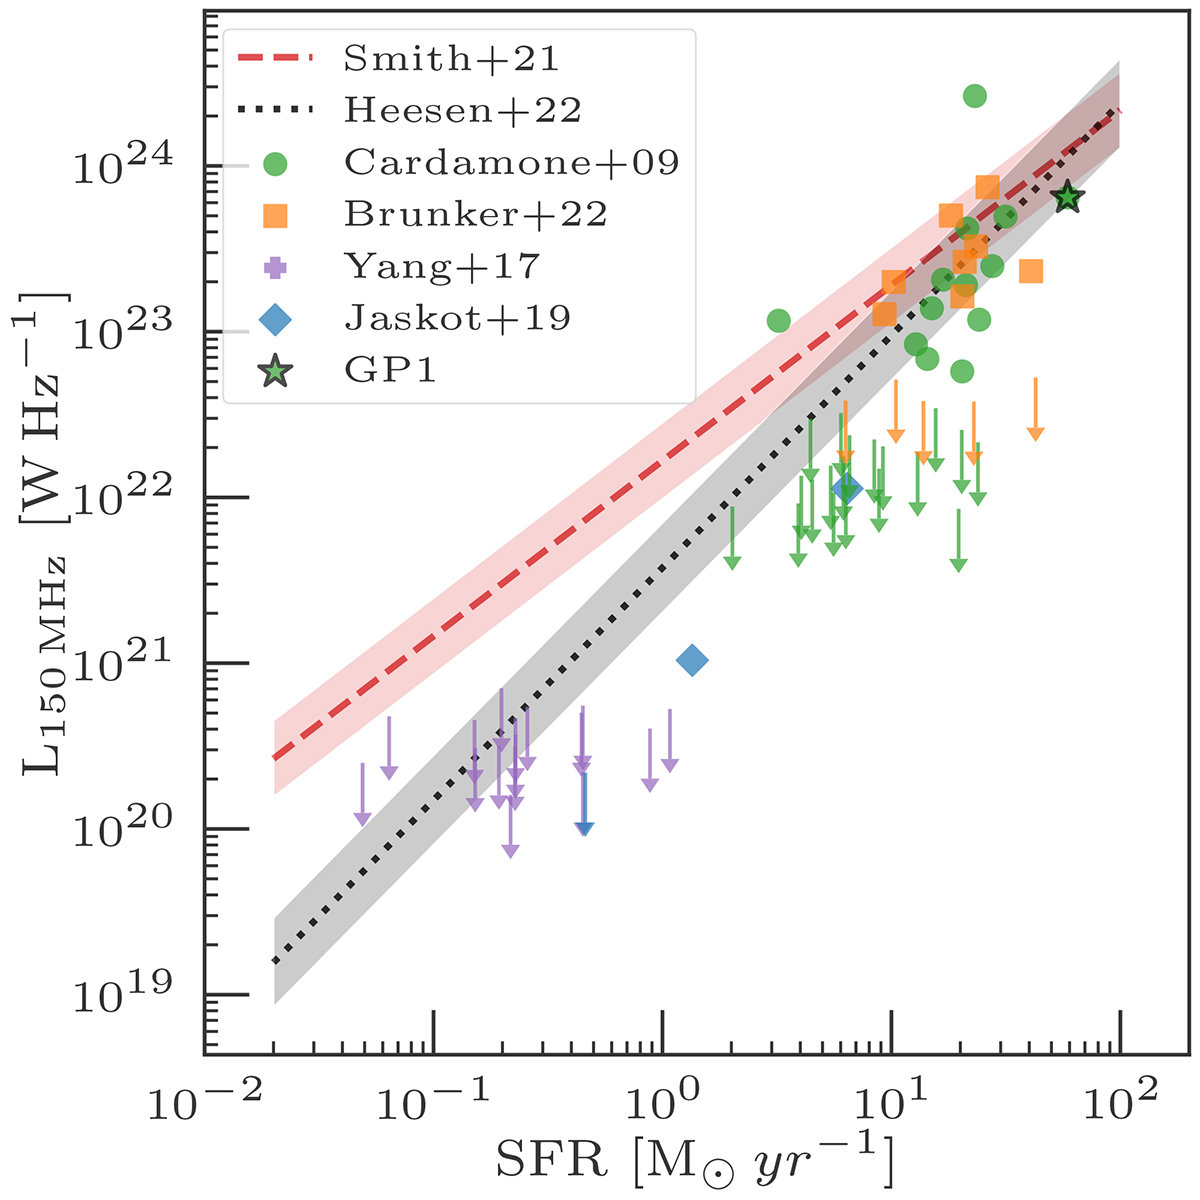
Fig. 4.
Download original image
Luminosities of the star-forming galaxies observed in the LoTSS survey at 150 MHz as a function of their SFR. The green circles and orange squares show the detected GPs while the purple crosses and blue diamonds show the detected BBs. The sources not detected in the LoTSS survey are shown by arrows as upper limits. The red dashed and the black dotted lines show the expected luminosity for a given SFR using the Smith et al. (2021) and Heesen et al. (2022) relations, respectively, and the shaded regions represent the scatter in the relations. The luminosities of most detected sources are either consistent or underluminous with respect to their SFR. All the undetected sources are significantly underluminous.
Current usage metrics show cumulative count of Article Views (full-text article views including HTML views, PDF and ePub downloads, according to the available data) and Abstracts Views on Vision4Press platform.
Data correspond to usage on the plateform after 2015. The current usage metrics is available 48-96 hours after online publication and is updated daily on week days.
Initial download of the metrics may take a while.