Open Access
Fig. 1.
Download original image
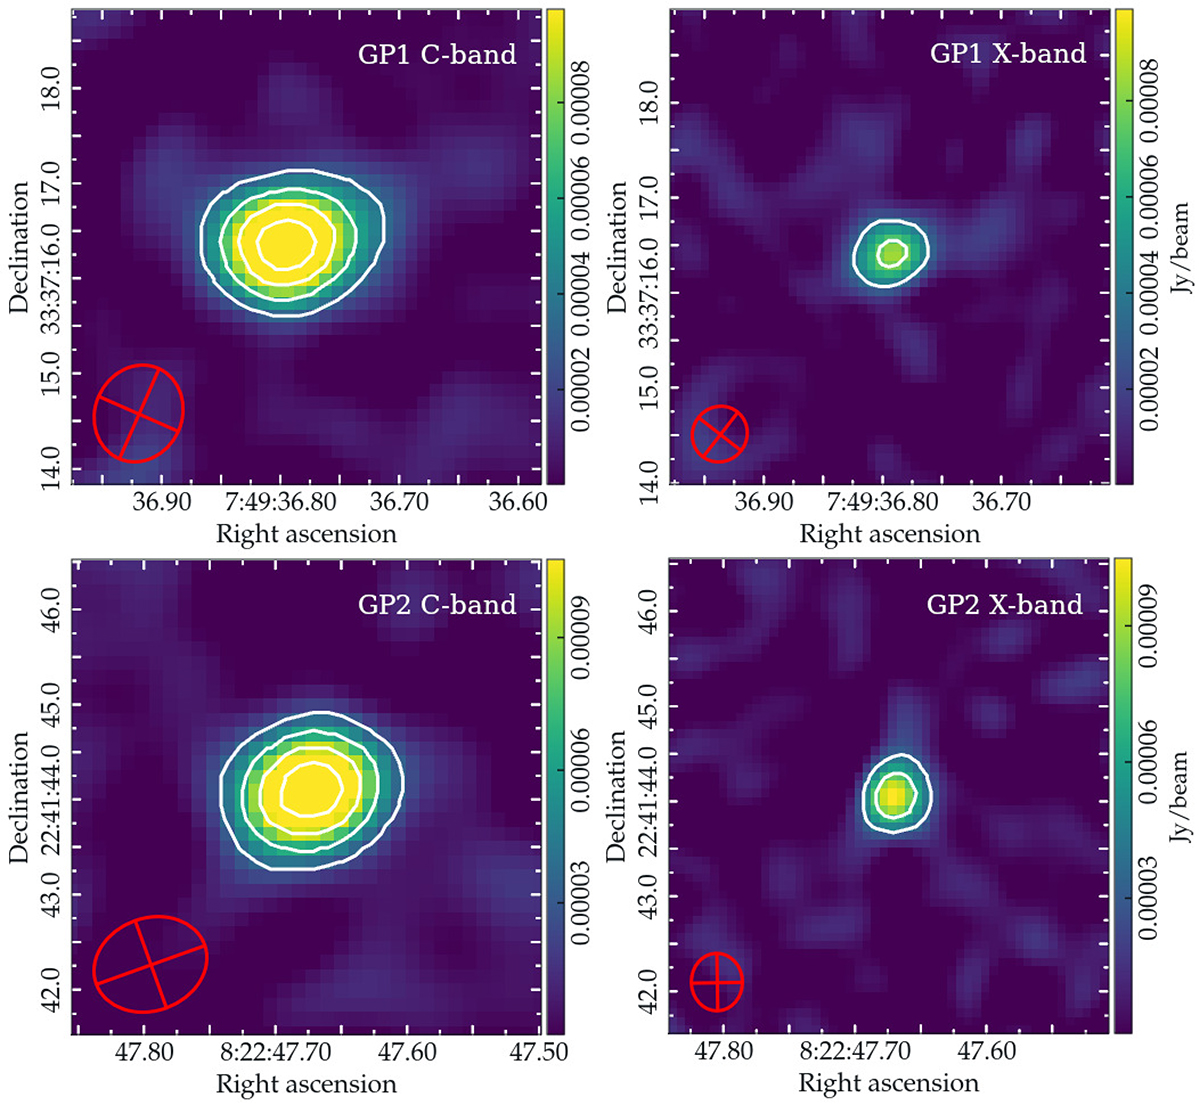
Completed JVLA observations of the GPs showing detections of GP1 and GP2 in the C- and X-bands. The red ellipses in the bottom-left corner indicate the beam size and shape. The white contours represent 1σ × (5, 9, 13, 17), where 1σ = 7 μJy.
Current usage metrics show cumulative count of Article Views (full-text article views including HTML views, PDF and ePub downloads, according to the available data) and Abstracts Views on Vision4Press platform.
Data correspond to usage on the plateform after 2015. The current usage metrics is available 48-96 hours after online publication and is updated daily on week days.
Initial download of the metrics may take a while.