Fig. 7
Download original image
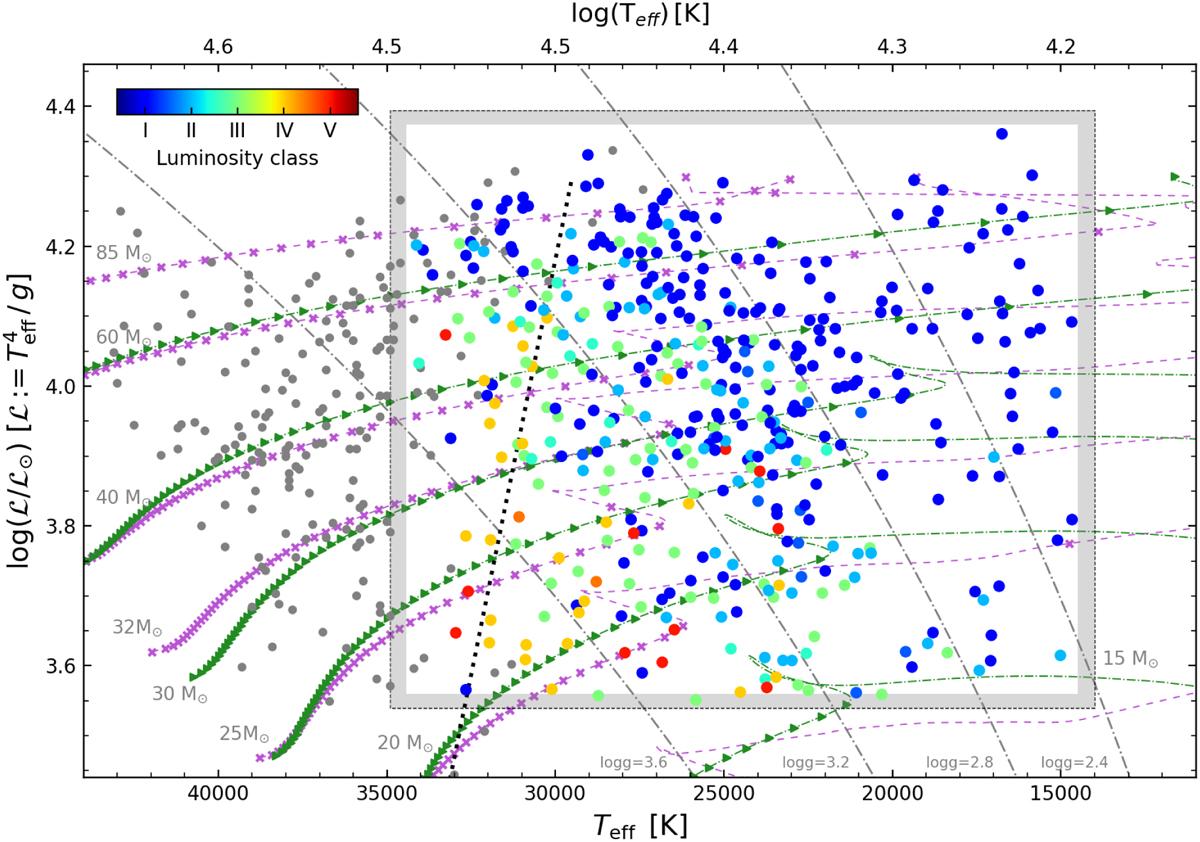
sHR diagram showing our results from the analysis for 527 stars with O9–B5 spectral type color-coded by their luminosity class, and 191 O-type stars from Hol18-22 in gray. The boundaries of our model grid are indicated with a rectangle. The shaded area indicates the approximate region where our results correspond to the upper or lower limits (see Sect. 3.2.4). The approximate separation between the O- and B-type stars is indicated with a dotted diagonal black line. For reference, the figure includes nonrotating evolutionary tracks with solar metallicity from the Geneva and Bonn models (Ekström et al. 2012; Georgy et al. 2013; Brott et al. 2011, respectively). Intervals of the same age difference are marked with purple crosses for Geneva and green triangles for Bonn, which are connected with dashed and dash-dotted lines of the same color. The dash-dotted gray lines indicate different constant log g values.
Current usage metrics show cumulative count of Article Views (full-text article views including HTML views, PDF and ePub downloads, according to the available data) and Abstracts Views on Vision4Press platform.
Data correspond to usage on the plateform after 2015. The current usage metrics is available 48-96 hours after online publication and is updated daily on week days.
Initial download of the metrics may take a while.