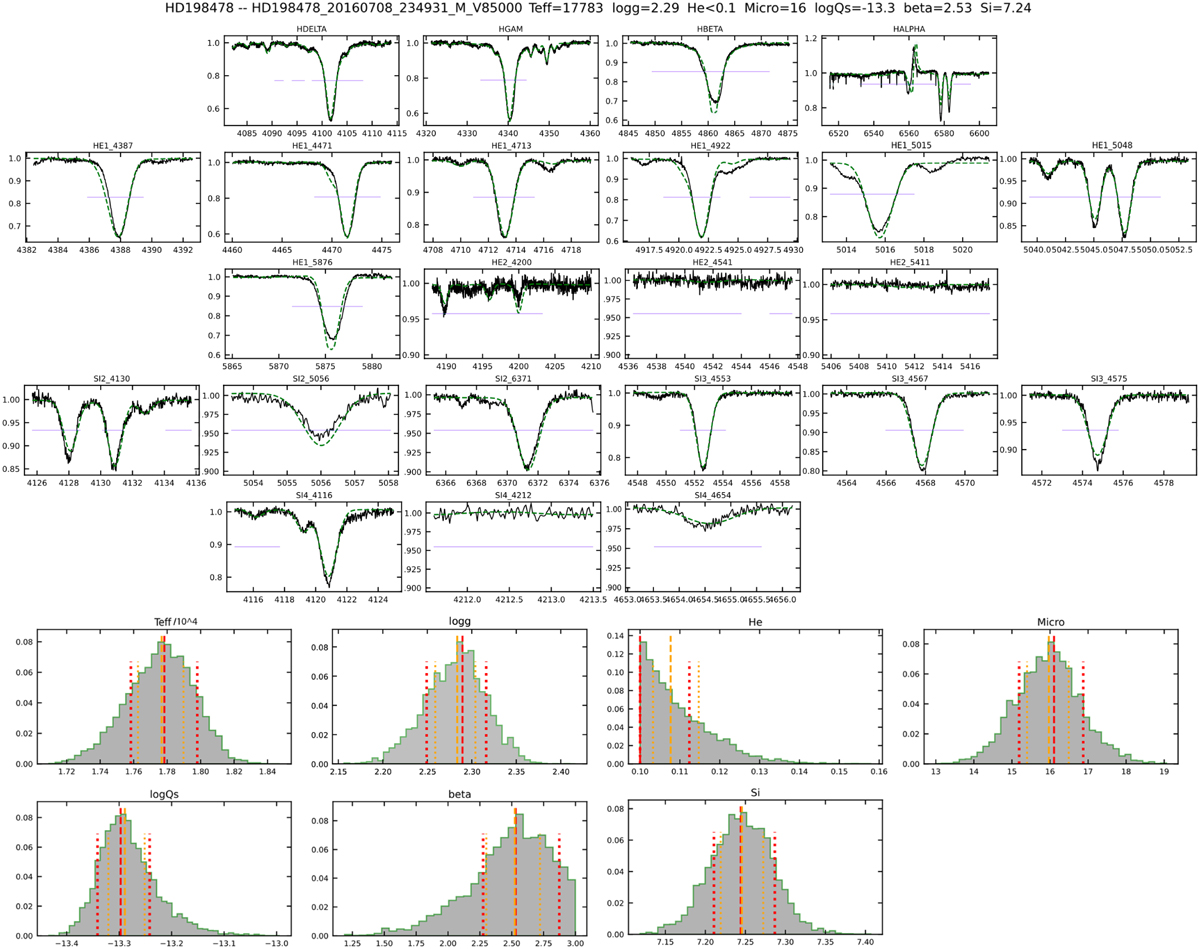
Fig. B.1
Download original image
Summary of the analysis for HD 198478. The subpanels of the top five rows show the observed spectra (solid black line) and synthetic model (dashed green line) in different diagnostic windows used in the analysis of our sample. Within each window, the purple horizontal line indicates which subregions have not been masked in the analysis. The subpanels in the bottom two rows are the associated probability distributions of each of the parameters derived in this work. The vertical dashed red and orange lines indicate the maximum and median of the distribution and associated uncertainties.
Current usage metrics show cumulative count of Article Views (full-text article views including HTML views, PDF and ePub downloads, according to the available data) and Abstracts Views on Vision4Press platform.
Data correspond to usage on the plateform after 2015. The current usage metrics is available 48-96 hours after online publication and is updated daily on week days.
Initial download of the metrics may take a while.