Fig. 13
Download original image
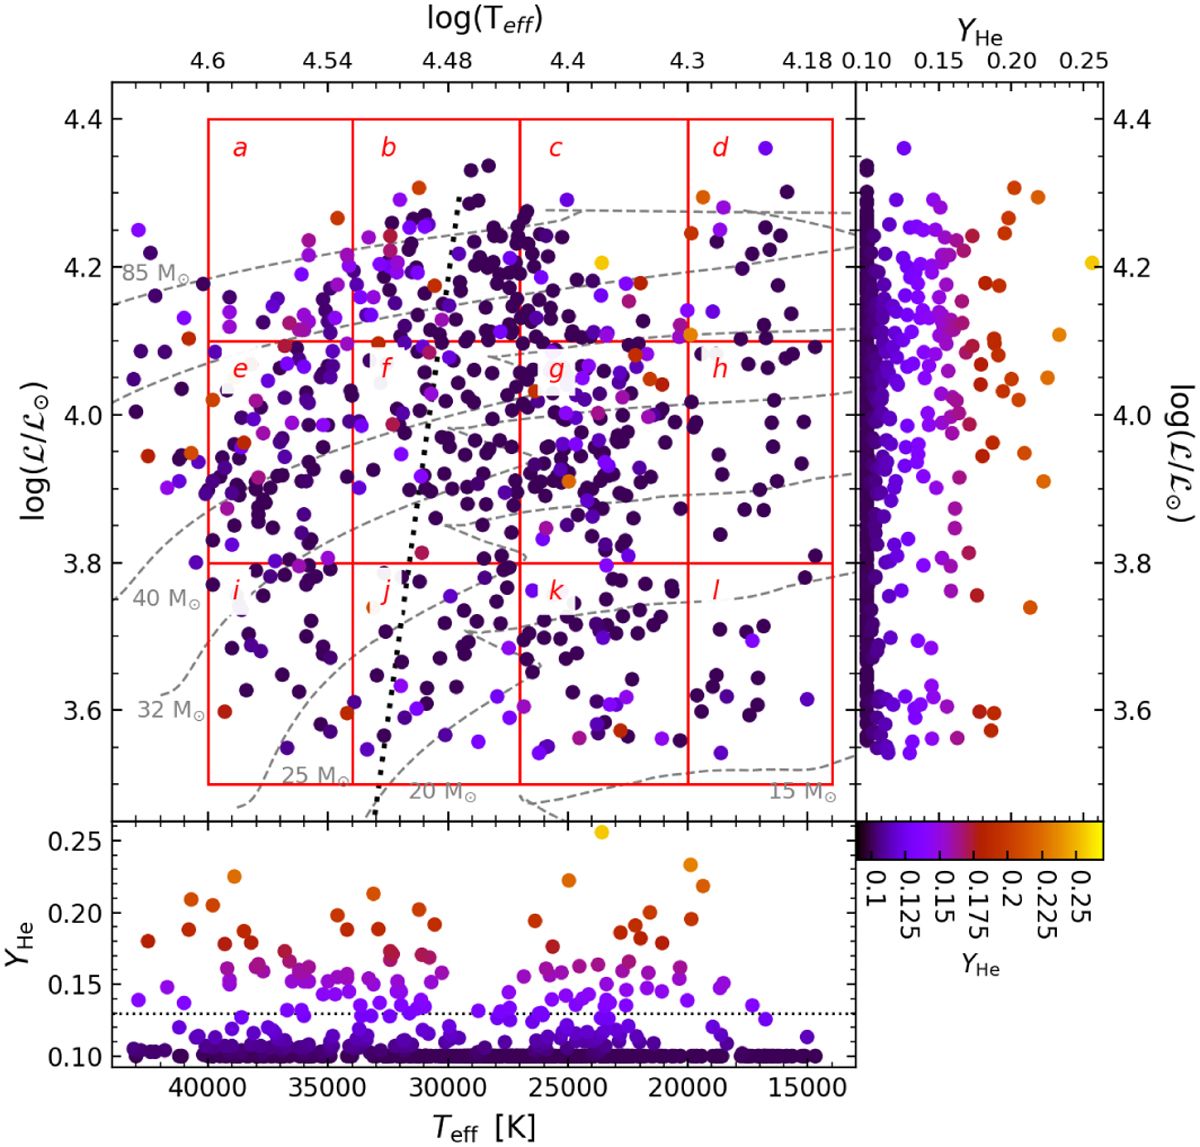
sHR diagram of the stars in the sample plus 191 O-type stars from Hol18-22, color-coded by helium abundance. We adopted YHe ≈ 0.10 as the lowest possible value. The bottom and right subpanels show YHe against Teff and log ℒ, respectively. The various subgroups of stars listed in Table 5 are indicated with red solid lines. Results considered as lower limits or degenerate are excluded. The bottom subpanel includes a horizontal dotted line at YHe =0.13. The evolutionary tracks are the same as in Fig. 7 for Geneva models.
Current usage metrics show cumulative count of Article Views (full-text article views including HTML views, PDF and ePub downloads, according to the available data) and Abstracts Views on Vision4Press platform.
Data correspond to usage on the plateform after 2015. The current usage metrics is available 48-96 hours after online publication and is updated daily on week days.
Initial download of the metrics may take a while.