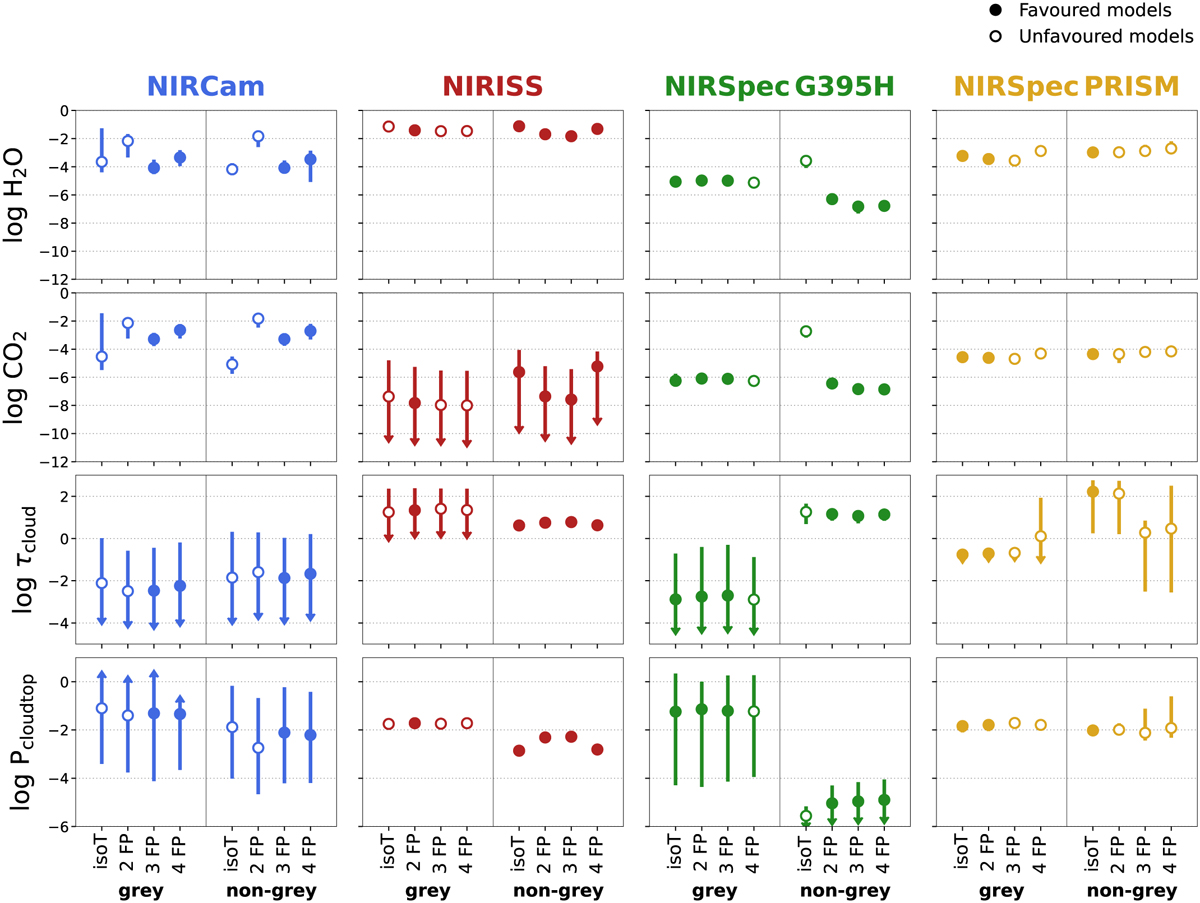
Fig. 4
Download original image
Comparing the median values of posterior distributions of selected parameters from retrievals performed on the four different spectra. Arrows indicate upper or lower limits. For each spectrum, a suite of four retrievals with different complexity of the temperature-pressure profile is performed. Isothermal profiles are denoted by “isoT”, while “FP” means that the temperature-pressure profile is parameterised by F fitting/free parameters. Separate suites of retrievals for grey versus non-grey cloud models are performed. Within each suite, filled circles are models where the logarithm of the Bayes factor is less than unity, implying that all of these models explain the data equally well. Within this subset of models indicated by filled circles, we choose the temperature-pressure profile that uses the least number of parameters in our subsequent explorations.
Current usage metrics show cumulative count of Article Views (full-text article views including HTML views, PDF and ePub downloads, according to the available data) and Abstracts Views on Vision4Press platform.
Data correspond to usage on the plateform after 2015. The current usage metrics is available 48-96 hours after online publication and is updated daily on week days.
Initial download of the metrics may take a while.