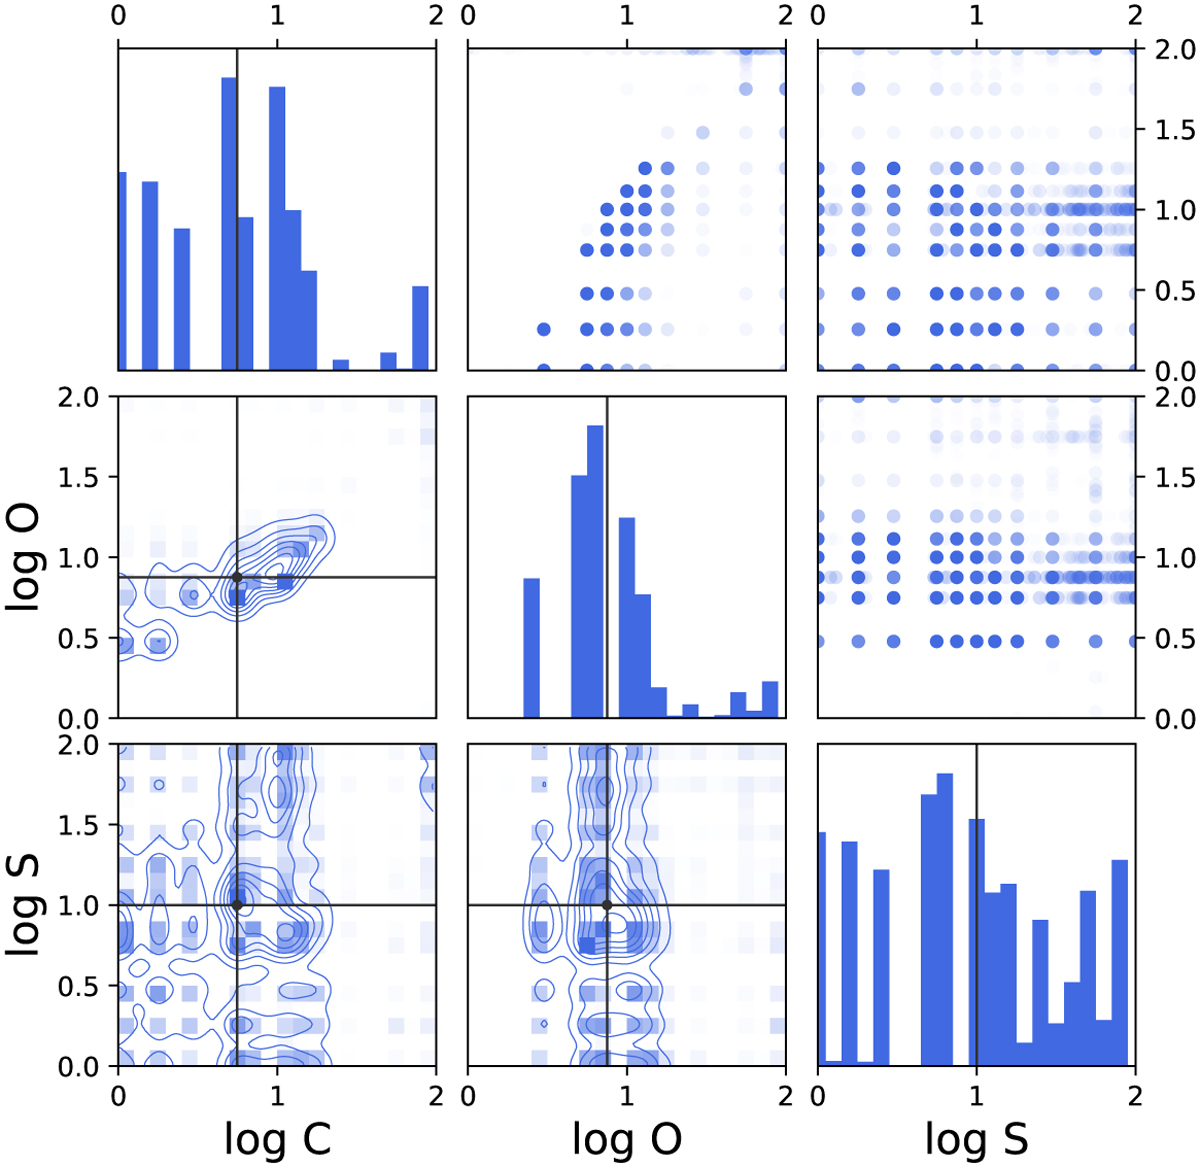
Fig. C.1
Download original image
Full set of posterior distributions from our random forest retrieval (trained on the model grid of Crossfield 2023) performed on the NIRCam spectrum. Shown are the logarithm (base 10) of the elemental abundances of C, O, and S, in terms of their solar value. In each scatter plot, every point represents an individual prediction generated by a single regression tree within the random forest ensemble. The solid vertical lines denote the median values of the posterior distributions.
Current usage metrics show cumulative count of Article Views (full-text article views including HTML views, PDF and ePub downloads, according to the available data) and Abstracts Views on Vision4Press platform.
Data correspond to usage on the plateform after 2015. The current usage metrics is available 48-96 hours after online publication and is updated daily on week days.
Initial download of the metrics may take a while.