Fig. 13.
Download original image
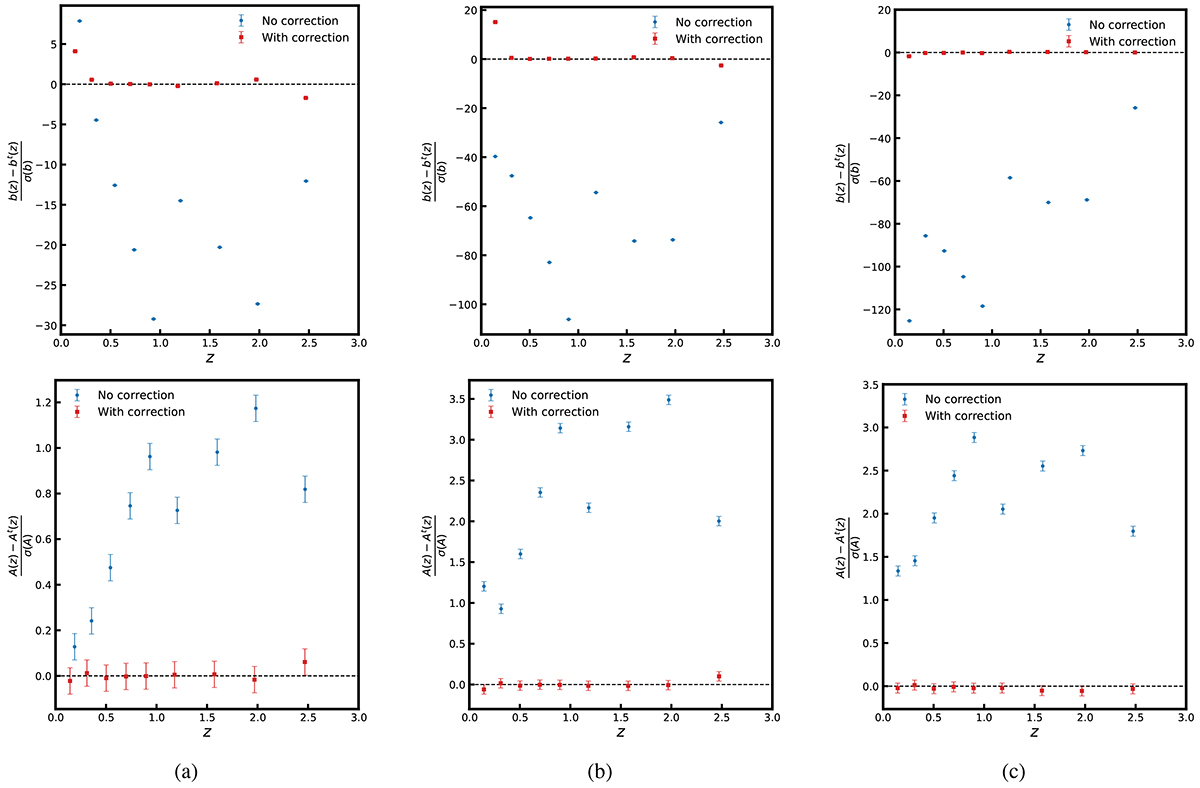
Comparison of the relative difference for linear galaxy bias (top) and for the cross-correlation amplitude estimated from the average power spectra (bottom) before (blue circles) and after (red squares) the correction for the redshift bin mismatch with (a) a Gaussian error distribution with σ0 = 0.02, (b) a Gaussian error distribution with σ0 = 0.05, and (c) a modified Lorentzian error distribution with γ0 = 0.02. The error bars on the data points correspond to the average spectra, and the standard deviations σ(b) and σ(A) correspond to a single realisation.
Current usage metrics show cumulative count of Article Views (full-text article views including HTML views, PDF and ePub downloads, according to the available data) and Abstracts Views on Vision4Press platform.
Data correspond to usage on the plateform after 2015. The current usage metrics is available 48-96 hours after online publication and is updated daily on week days.
Initial download of the metrics may take a while.