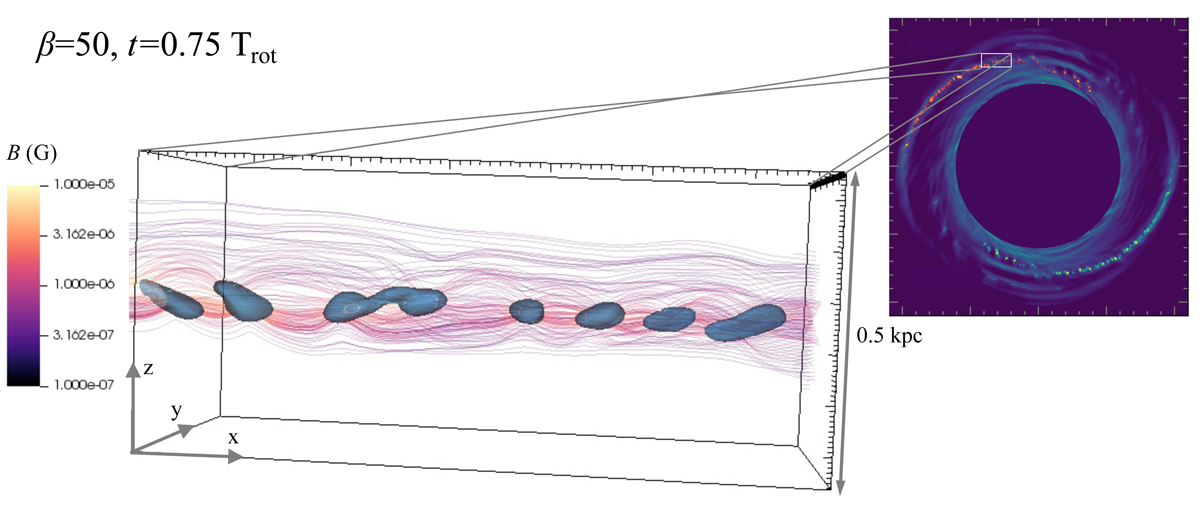
Fig. 9.
Download original image
Magnetic field lines in a section of one of the spiral arms for the β = 50 simulation at t = 0.75 Trot. The magnetic field lines, coloured by their magnitude, were initialised on the right face (yz) of the region, in a circular plane of radius 250 pc, with its z-axis aligned with that of the clouds. The clouds are shown in blue iso-contours with a threshold density of about twice the critical density of the thermally unstable medium. We can see magnetic field loops rise above and below the plane of the clouds on scales of ∼100 pc. This is an indication that the Parker instability might play a role for the spiral arm stability.
Current usage metrics show cumulative count of Article Views (full-text article views including HTML views, PDF and ePub downloads, according to the available data) and Abstracts Views on Vision4Press platform.
Data correspond to usage on the plateform after 2015. The current usage metrics is available 48-96 hours after online publication and is updated daily on week days.
Initial download of the metrics may take a while.