Fig. 8.
Download original image
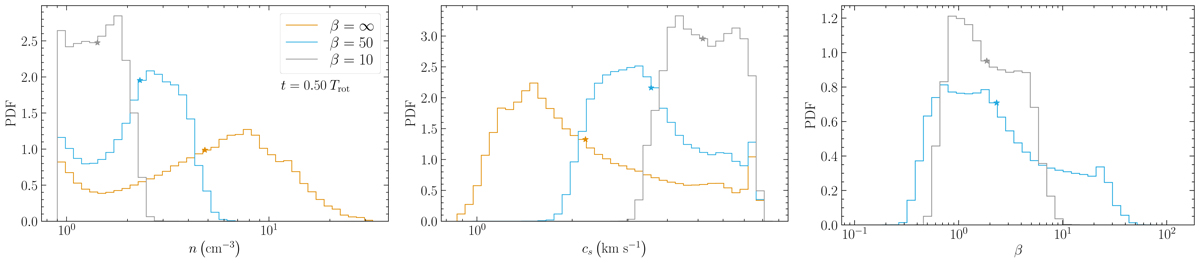
Mass-weighted probability density functions (PDFs) of the log10 of the physical quantities of the gas in spiral arms. The left panel shows the gas density, the middle panel shows the sound speed and the right panel shows the cell-by-cell plasma-beta of the traced spiral arms at t = 0.5 Trot. The stars mark the mass-weighted average of the log10 of the quantity in each case. In the left panel, we see that the spiral arms become more diffuse with increasing magnetisation. The middle panel shows that the gas becomes colder with increasing density as the cooling sets in. In the right panel we see that, the plasma-beta of the magnetic runs have decreased significantly in the arms (compared to the simulation starting value of β), especially for the β = 50 case, where the plasma-beta has risen from 50 to an average of 2.3, becoming comparable to the β = 10 case.
Current usage metrics show cumulative count of Article Views (full-text article views including HTML views, PDF and ePub downloads, according to the available data) and Abstracts Views on Vision4Press platform.
Data correspond to usage on the plateform after 2015. The current usage metrics is available 48-96 hours after online publication and is updated daily on week days.
Initial download of the metrics may take a while.