Fig. 6.
Download original image
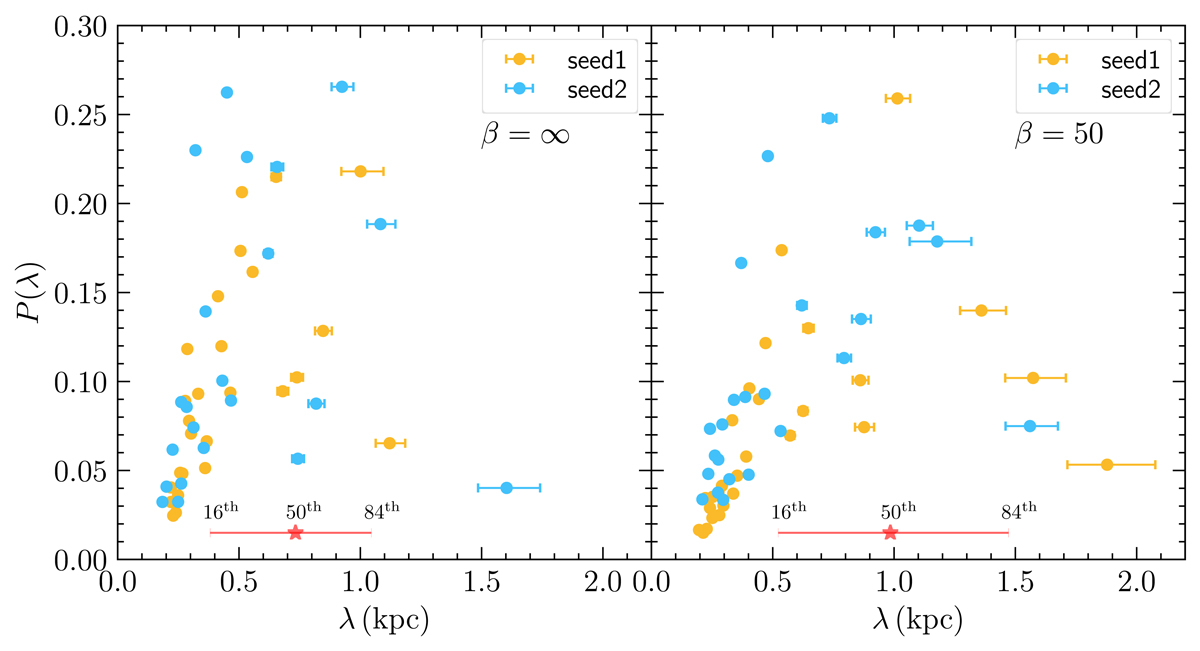
Power (P(λ)) of the extracted peaks of the Fourier transforms of the projected density along the masked spiral arms plotted against the physical scale in kpc. The two panels show the hydro and the β = 50 cases at t = 0.9 Trot. The two runs with different random seeds are shown in yellow and blue, respectively. In each case, we have included the peaks found for the two spiral arms. The star marks the 50th percentile, and the error bars indicate the range from 16th to 84th percentile of the peaks binned in 0.2 kpc bins. It increases from ![]() kpc in the hydro case to
kpc in the hydro case to ![]() kpc in the magnetic case. However, peaks with the highest power in both the runs are present on length scales of ∼0.5 − 1.0 kpc.
kpc in the magnetic case. However, peaks with the highest power in both the runs are present on length scales of ∼0.5 − 1.0 kpc.
Current usage metrics show cumulative count of Article Views (full-text article views including HTML views, PDF and ePub downloads, according to the available data) and Abstracts Views on Vision4Press platform.
Data correspond to usage on the plateform after 2015. The current usage metrics is available 48-96 hours after online publication and is updated daily on week days.
Initial download of the metrics may take a while.